10.17 Computing statistics in genomic intervals
We’ve so far computed the \(D\), \(f_4\), and \(f_4\)-ratio statistics across the entire genome, but we can also restrict computation to particular genomic intervals, such as genes, promoters, enhancers, etc.
What would region-specific differences imply?
Region-specific differences suggest that there are some regions of the genome that are particularly tolerant or intolerant to introgression.
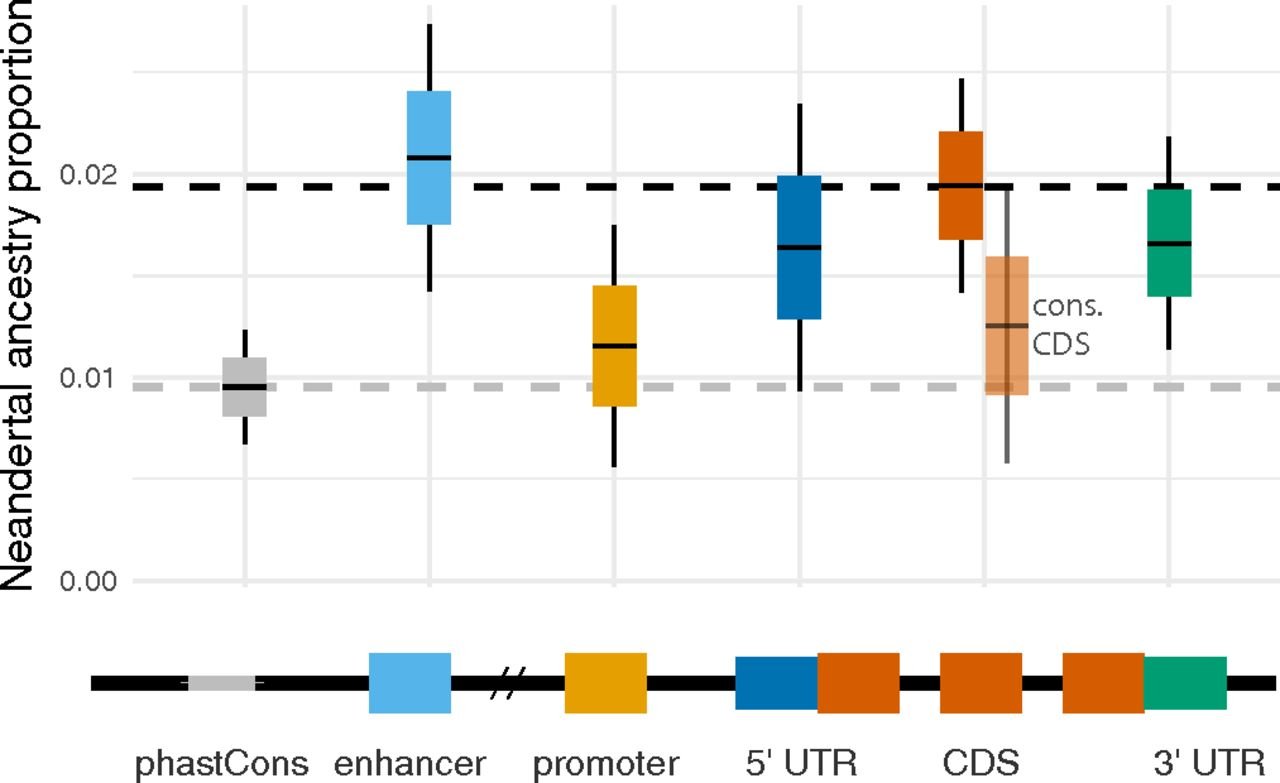
In the figure below, we see that the genome-wide average percentage of Neanderthal ancestry is ~2%, but there are some genomic regions (promoters, evolutionarily conserved sequences) where this percentage is lower.
One theory explaining this pattern is that Neanderthals accumulated a genetic load of slightly deleterious mutations due to their small population sizes. Consequently, when Neanderthal sequences were introgressed into human populations, they were subjected to negative selection, which was stronger in more functionally important regions of the genome.