3.11 Required homework
The data from the paper has been pre-filtered for you. Run this code block to read it in:
# read data
crossovers <- read.table("crossovers.tsv", header = TRUE)

# preview data
head(crossovers)
## Proband_id n_pat_xover n_mat_xover Father_age Mother_age
## 1 3 22 51 29 28
## 2 10 26 50 26 26
## 3 11 25 38 25 22
## 4 15 24 50 31 26
## 5 20 27 35 26 24
## 6 22 28 40 39 31The columns in this table are:
Proband_id: ID of the childn_pat_xover: Number of crossovers (carried by the child) that occurred in the paternal gametesn_mat_xover: Number of crossovers that occurred in the maternal gametesFather_age: Father’s age at proband’s birthMother_age: Mother’s age at proband’s birth
Assignment: Using the ggplot code from this module, plot the relationship between parental age and number of crossovers. As with the DNM data, make one plot for the maternal crossovers and one plot for the paternal. Do you think parental age impacts crossover number?
Solution
Plot paternal crossovers:
ggplot(data = crossovers,
       # x axis is paternal age
       aes(x = Father_age,
           # y axis is number of crossovers
           y = n_pat_xover)) +
  geom_point()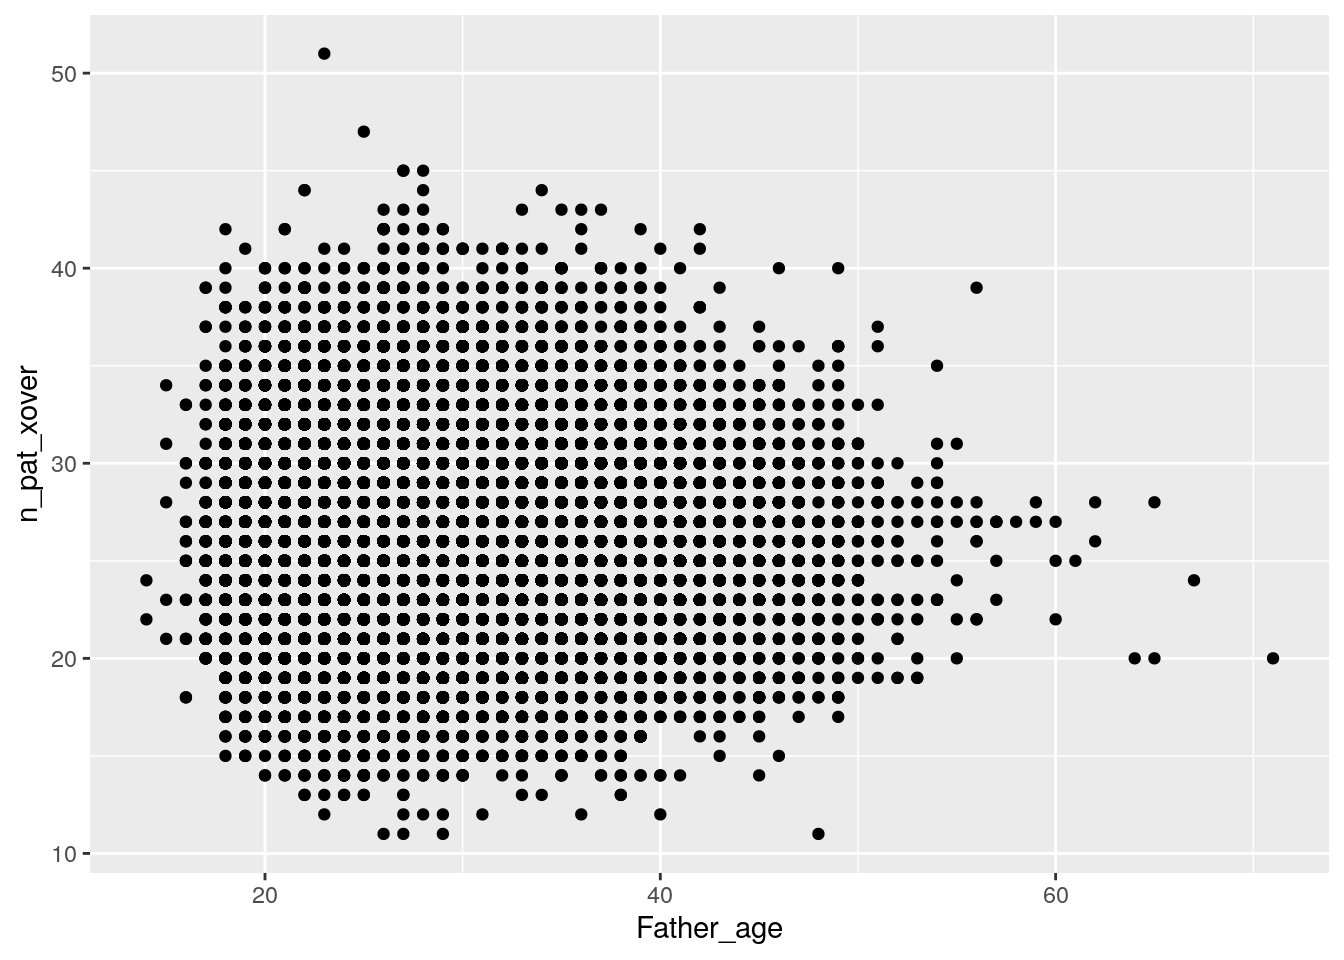
Plot maternal crossovers:
ggplot(data = crossovers,
       # x axis is maternal age
       aes(x = Mother_age,
           # y axis is number of crossovers
           y = n_mat_xover)) +
  geom_point()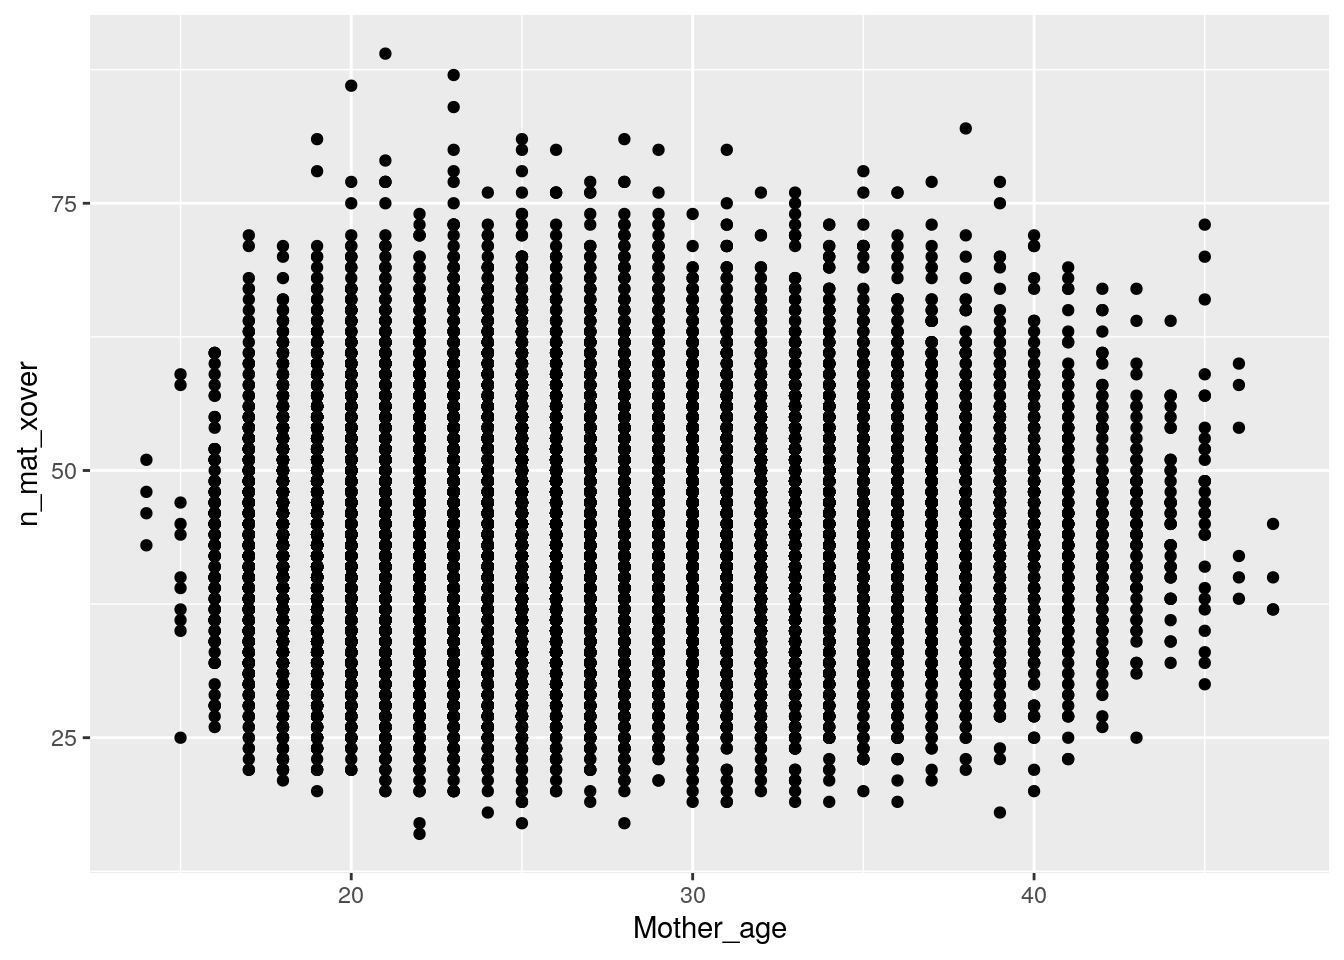
Just by eye, it doesn’t really seem that age affects number of crossovers for either mothers or fathers.