9.10 Top GST hits
The variants with high \(\textrm{G}_{ST}\) values should show differences in allele frequency between populations. Let’s examine the top-scoring variant:
##   CHROM      POS    Hs_AFR    Hs_AMR    Hs_EAS     Hs_EUR    Hs_SAS        Ht
## 1 chr21 17753762 0.3537087 0.2017499 0.1326531 0.02931902 0.0400634 0.3650242
##   n_AFR n_AMR n_EAS n_EUR n_SAS      Gst     Htmax   Gstmax  Gprimest
## 1  1320   694  1008  1008   978 0.557253 0.8286973 0.804979 0.6922578
We can use the GGV browser to visualize this variant’s allele frequencies across the 1000 Genomes populations.
One complicating factor is that the browser is based on the hg19 reference genome, while we’re working with a VCF on the more recent hg38 coordinate system.
How do you compare variants between genome builds?
There are many ways of converting from genome coordinate system to the other. One way is to look up the ID of the SNP in the UCSC Genome Browser, using its chromosome and position:
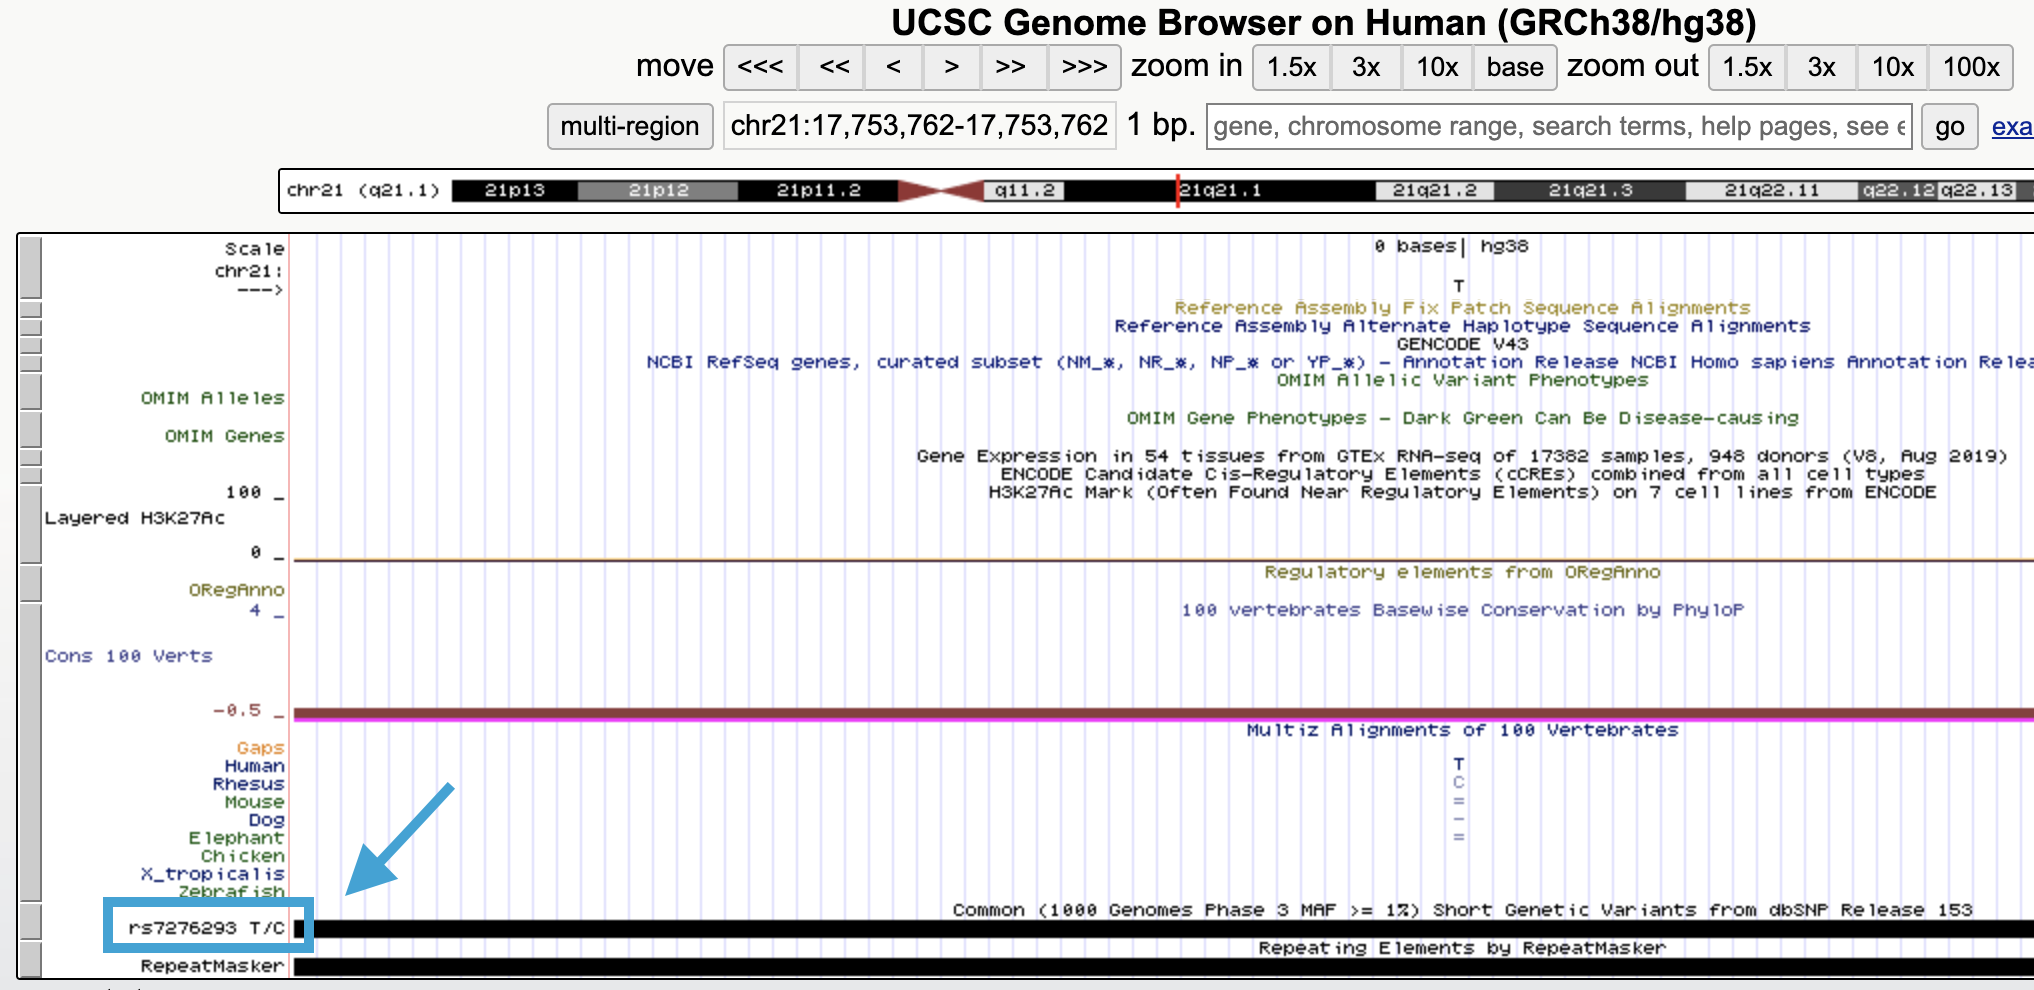
Fig. 4. Identifying a SNP’s rsID in the UCSC Genome Browser.
This SNP has the ID rs7276293, which should be consistent between reference builds.