6.11 Principal component analysis
Principal component analysis (PCA) is a method for representing high-dimensional data (i.e., data with many variables) within a smaller number of dimensions. In our case, every individual in the VCF has genotype measurements for hundreds of variants.
You can think of PCA as a projection all the individuals in our dataset into a cloud, where their position is determined by their combination of genotypes.
- The first principal component (PC) is the vector through the cloud of data points that captures the greatest possible variance.
- The second PC is the vector that captures the second greatest possible variance, and must also be perpendicular to the first vector.
- The same idea applies to the third, fourth, fifth, etc. PCs.
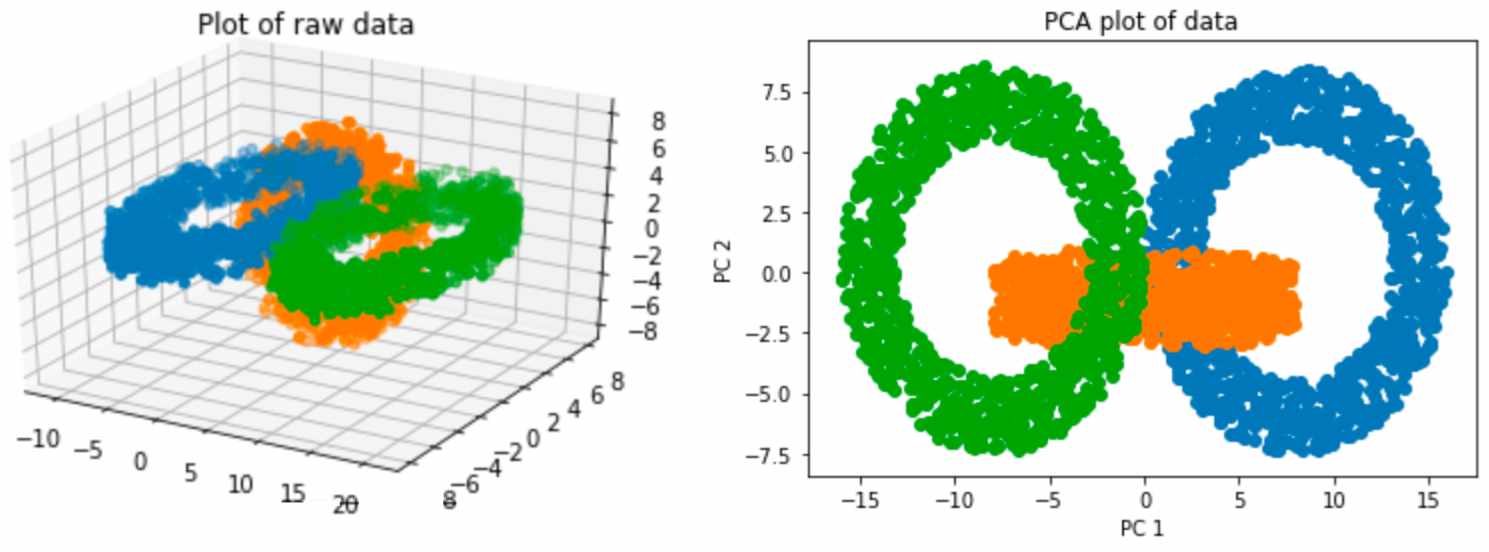
Fig. 3. A PCA plot that simplifies three-dimensional data into two dimensions.
For an in-depth visual walkthrough of PCA, you can go to this website.