6.7 The allele frequency spectrum
One common visualization of genotype data is the allele frequency spectrum (AFS), which is the distribution of the allele frequencies of the variants.
Plot the AFS of all variants, using the data in the AF column.
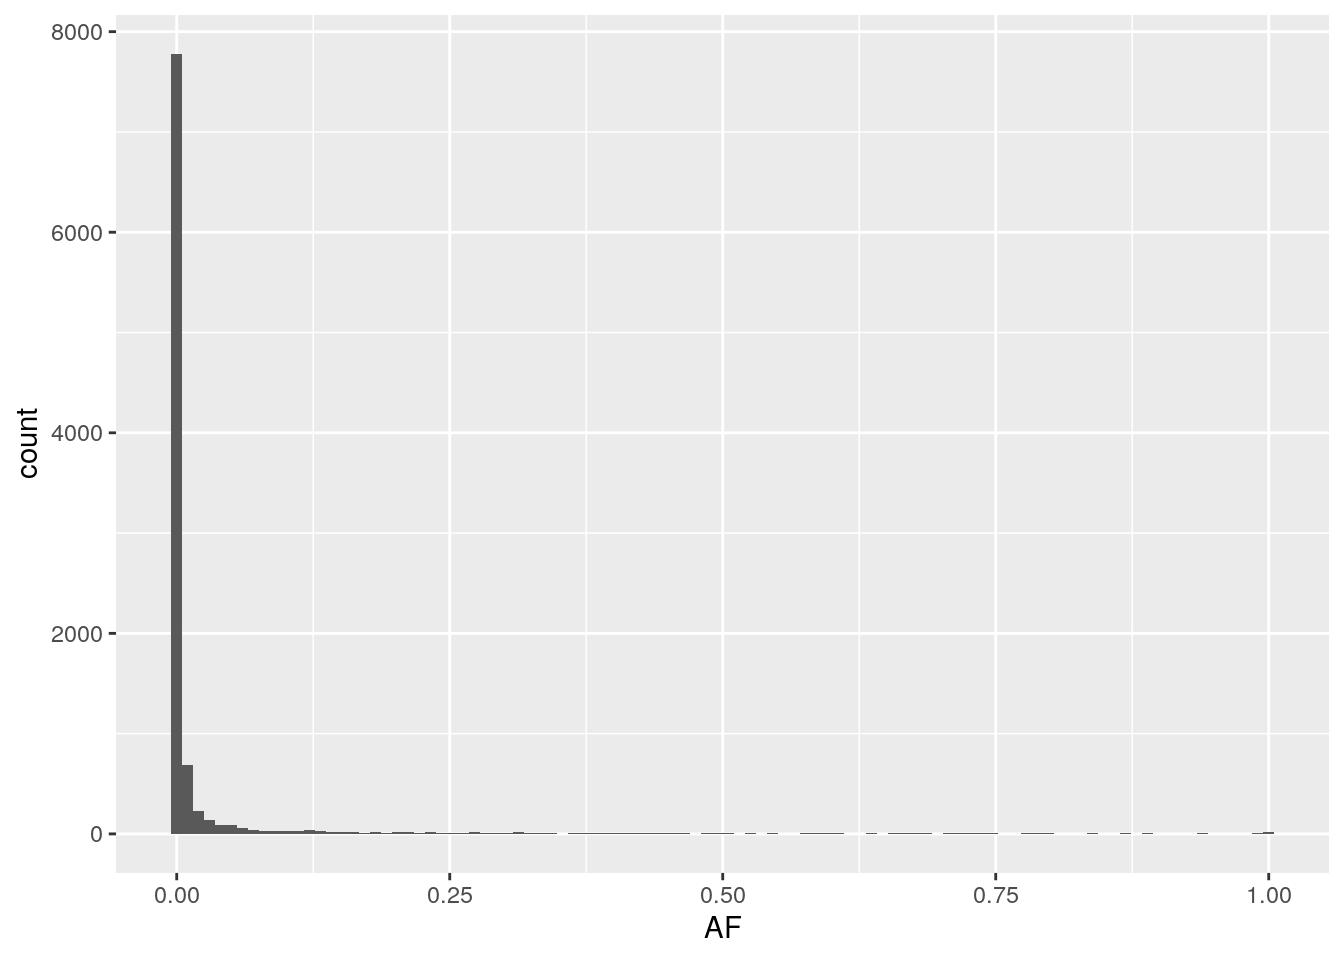
Interpreting the AFS
The allele frequencies in this dataset range from 0 to 1, with an exponential decay from zero, indicating that the majority of variants are rare.
This is the expected shape of an AFS, since all variants arise in one individual and are unlikely to spread widely through the population just by chance. This distribution is exacerbated in human populations, where recent population expansions have resulted in an excess of rare variation.