5.5 The binomial distribution
Instead of having to actually simulate all the coin flips, we can get the number of allele carriers by performing a single draw from a binomial distribution with size N (# of individual) and success probability p = AF. This distribution tells you how many successes you expect to see from a set of N independent coin flips.
If we try to draw 100,000 times from a binomial distribution with population size 100 and success probability (AF) 0.5, it will look something like this:
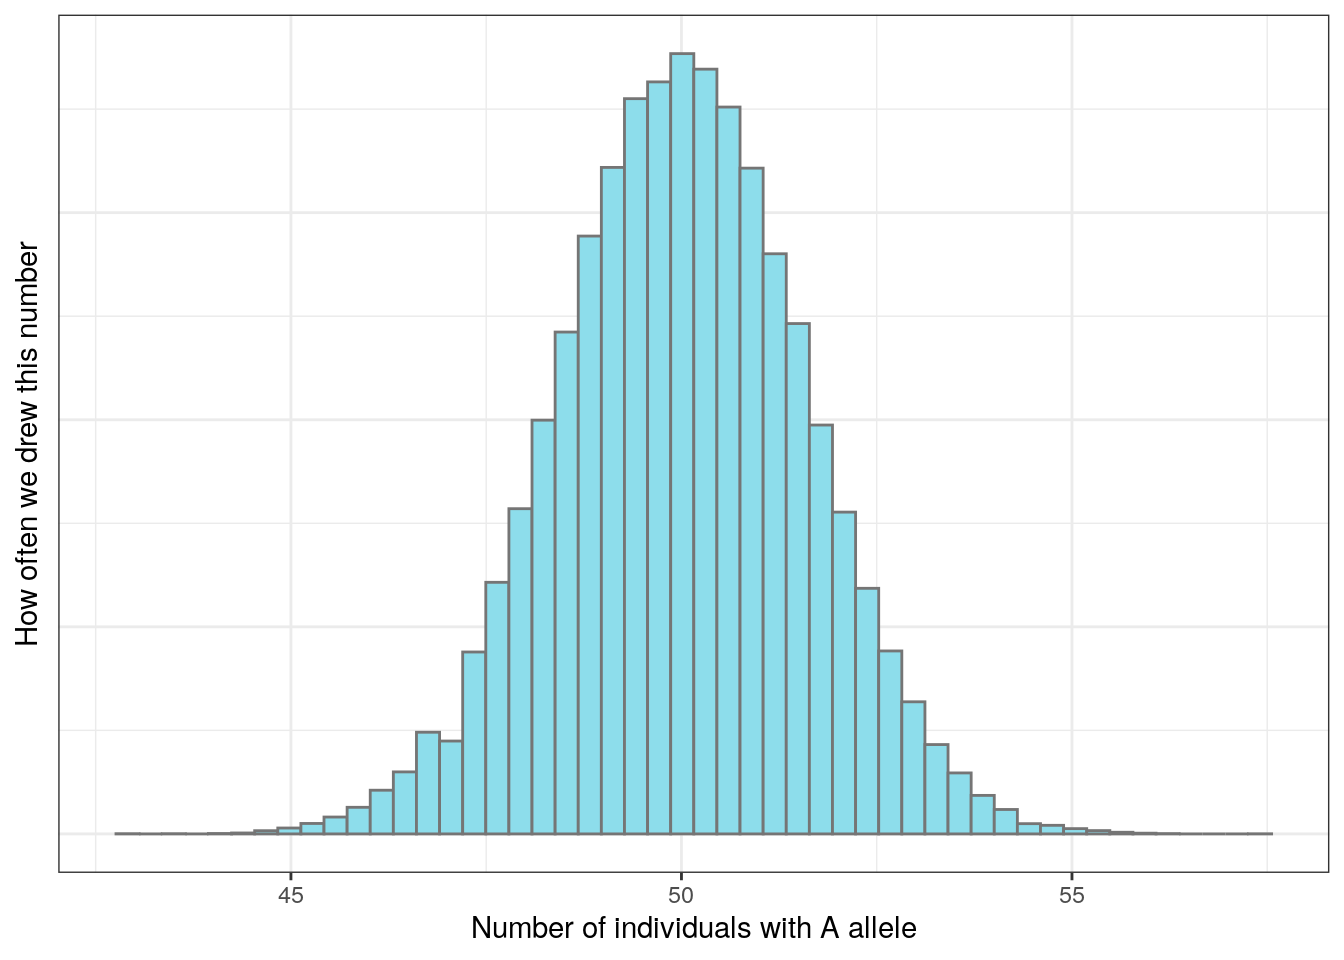
Figure 5.1: 100,000 draws from a binomial distribution.
The majority of the distribution lies between 48 and 52. Just as we expect based on the allele frequency, the next generation will most likely have around 48-52 individuals with the A allele. But because this is a random draw, there’s a small chance that we might end up with many more or many fewer than that number.