8.12 Genotype-phenotype boxplots
First, let’s plot the relationship between genotype and phenotype to see if it looks interesting.
Create boxplots of the phenotype, stratified by genotype of the test SNP.
## Warning: Removed 1 row containing non-finite outside the scale range
## (`stat_boxplot()`).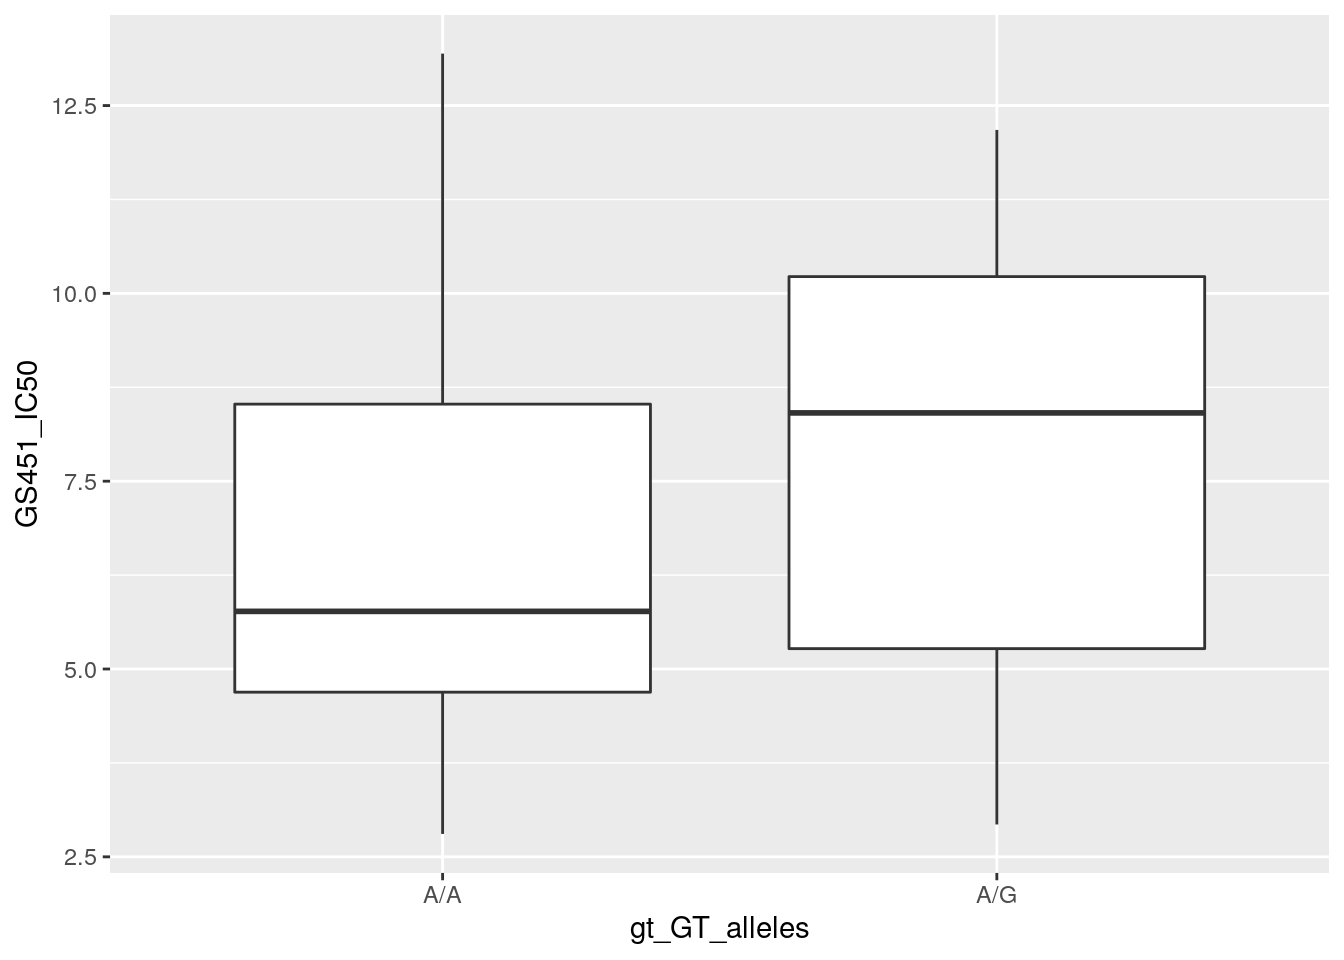
It’s unclear whether there’s a relationship here, because the phenotype distributions for these two genotypes are mostly overlapping. To be certain, we’ll now test this with linear regression.