6.3 Geography of Genetic Variants
One quick way to visualize population structure in humans is to look at the allele frequencies of genetic variants in different regions of the world. The Geography of Genetic Variants (GGV) browser is a website that plots allele frequencies from the 1000 Genomes dataset.
For a given variant, GGV plots piecharts of its frequency in the 26 populations in 1000 Genomes, superimposed over the population’s geographical location.
While some variants have very similar frequencies across populations, others are much more common in specific populations – usually suggesting that these populations are more closely related to each other.
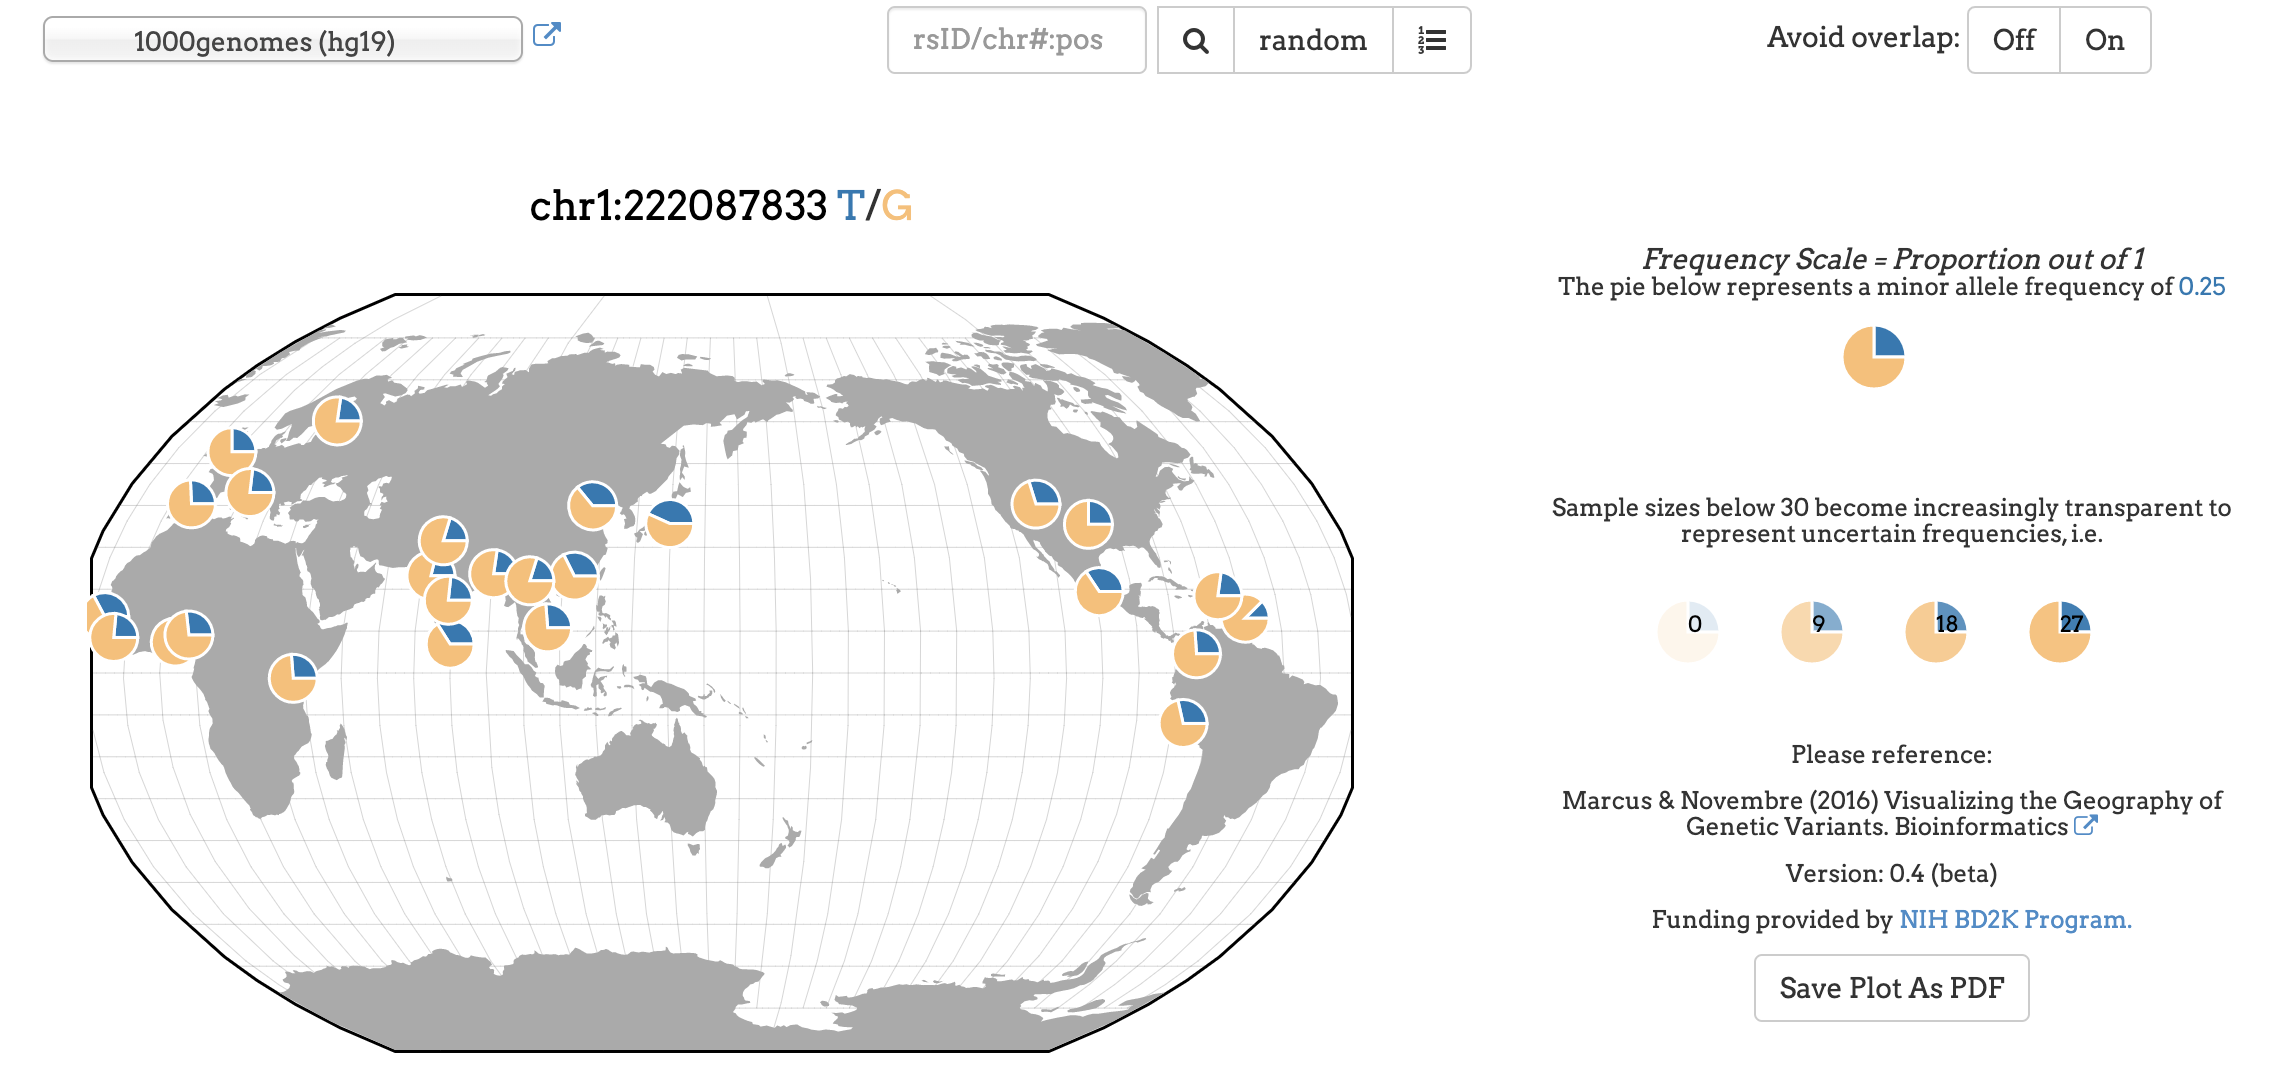
Fig. 2. GGV visualization of the allele frequencies for a SNP at
chr1:222087833.