9.9 Distribution of GST across the genome
Plot the distribution of \(\textrm{G}_{ST}\) values from genetic_diff
## `stat_bin()` using `bins = 30`. Pick better value with `binwidth`.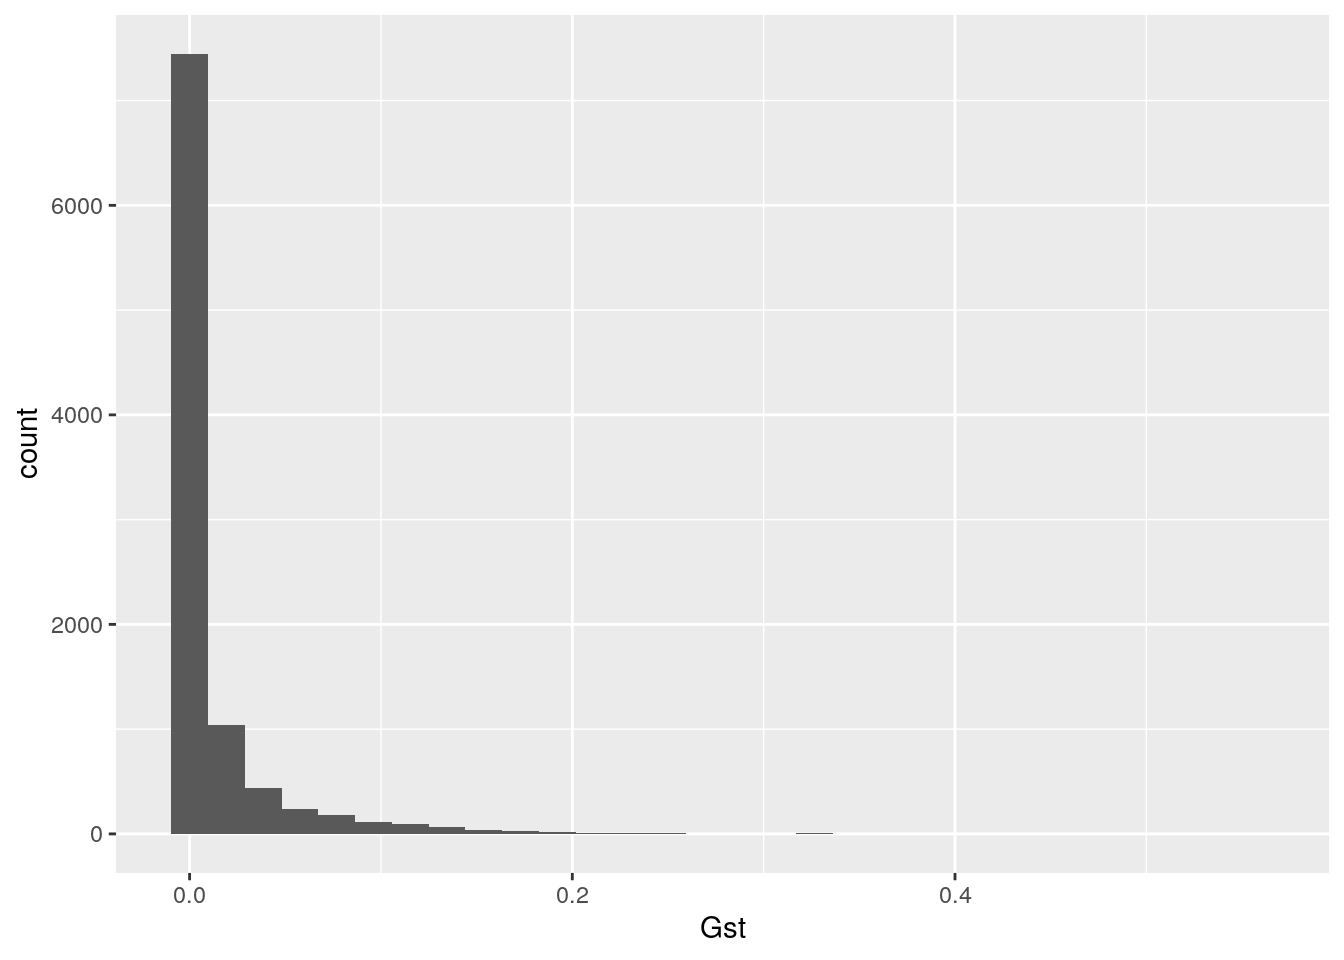
This is an exponentially decaying distribution, indicating that most common human variants don’t show strong differences in allele frequency between populations.