7.9 Interpreting GWAS results
Let’s look at a browser of GWAS results, generated by a study that used genotype and phenotype data from the UK Biobank.
UK Biobank
UK Biobank is one of the largest cohorts of genotype and phenotype data available.
This study has data from ~500,000 individuals across the UK, including health records and responses to surveys, all of which are publicly available for research.
As an example, let’s look up associations with standing height.
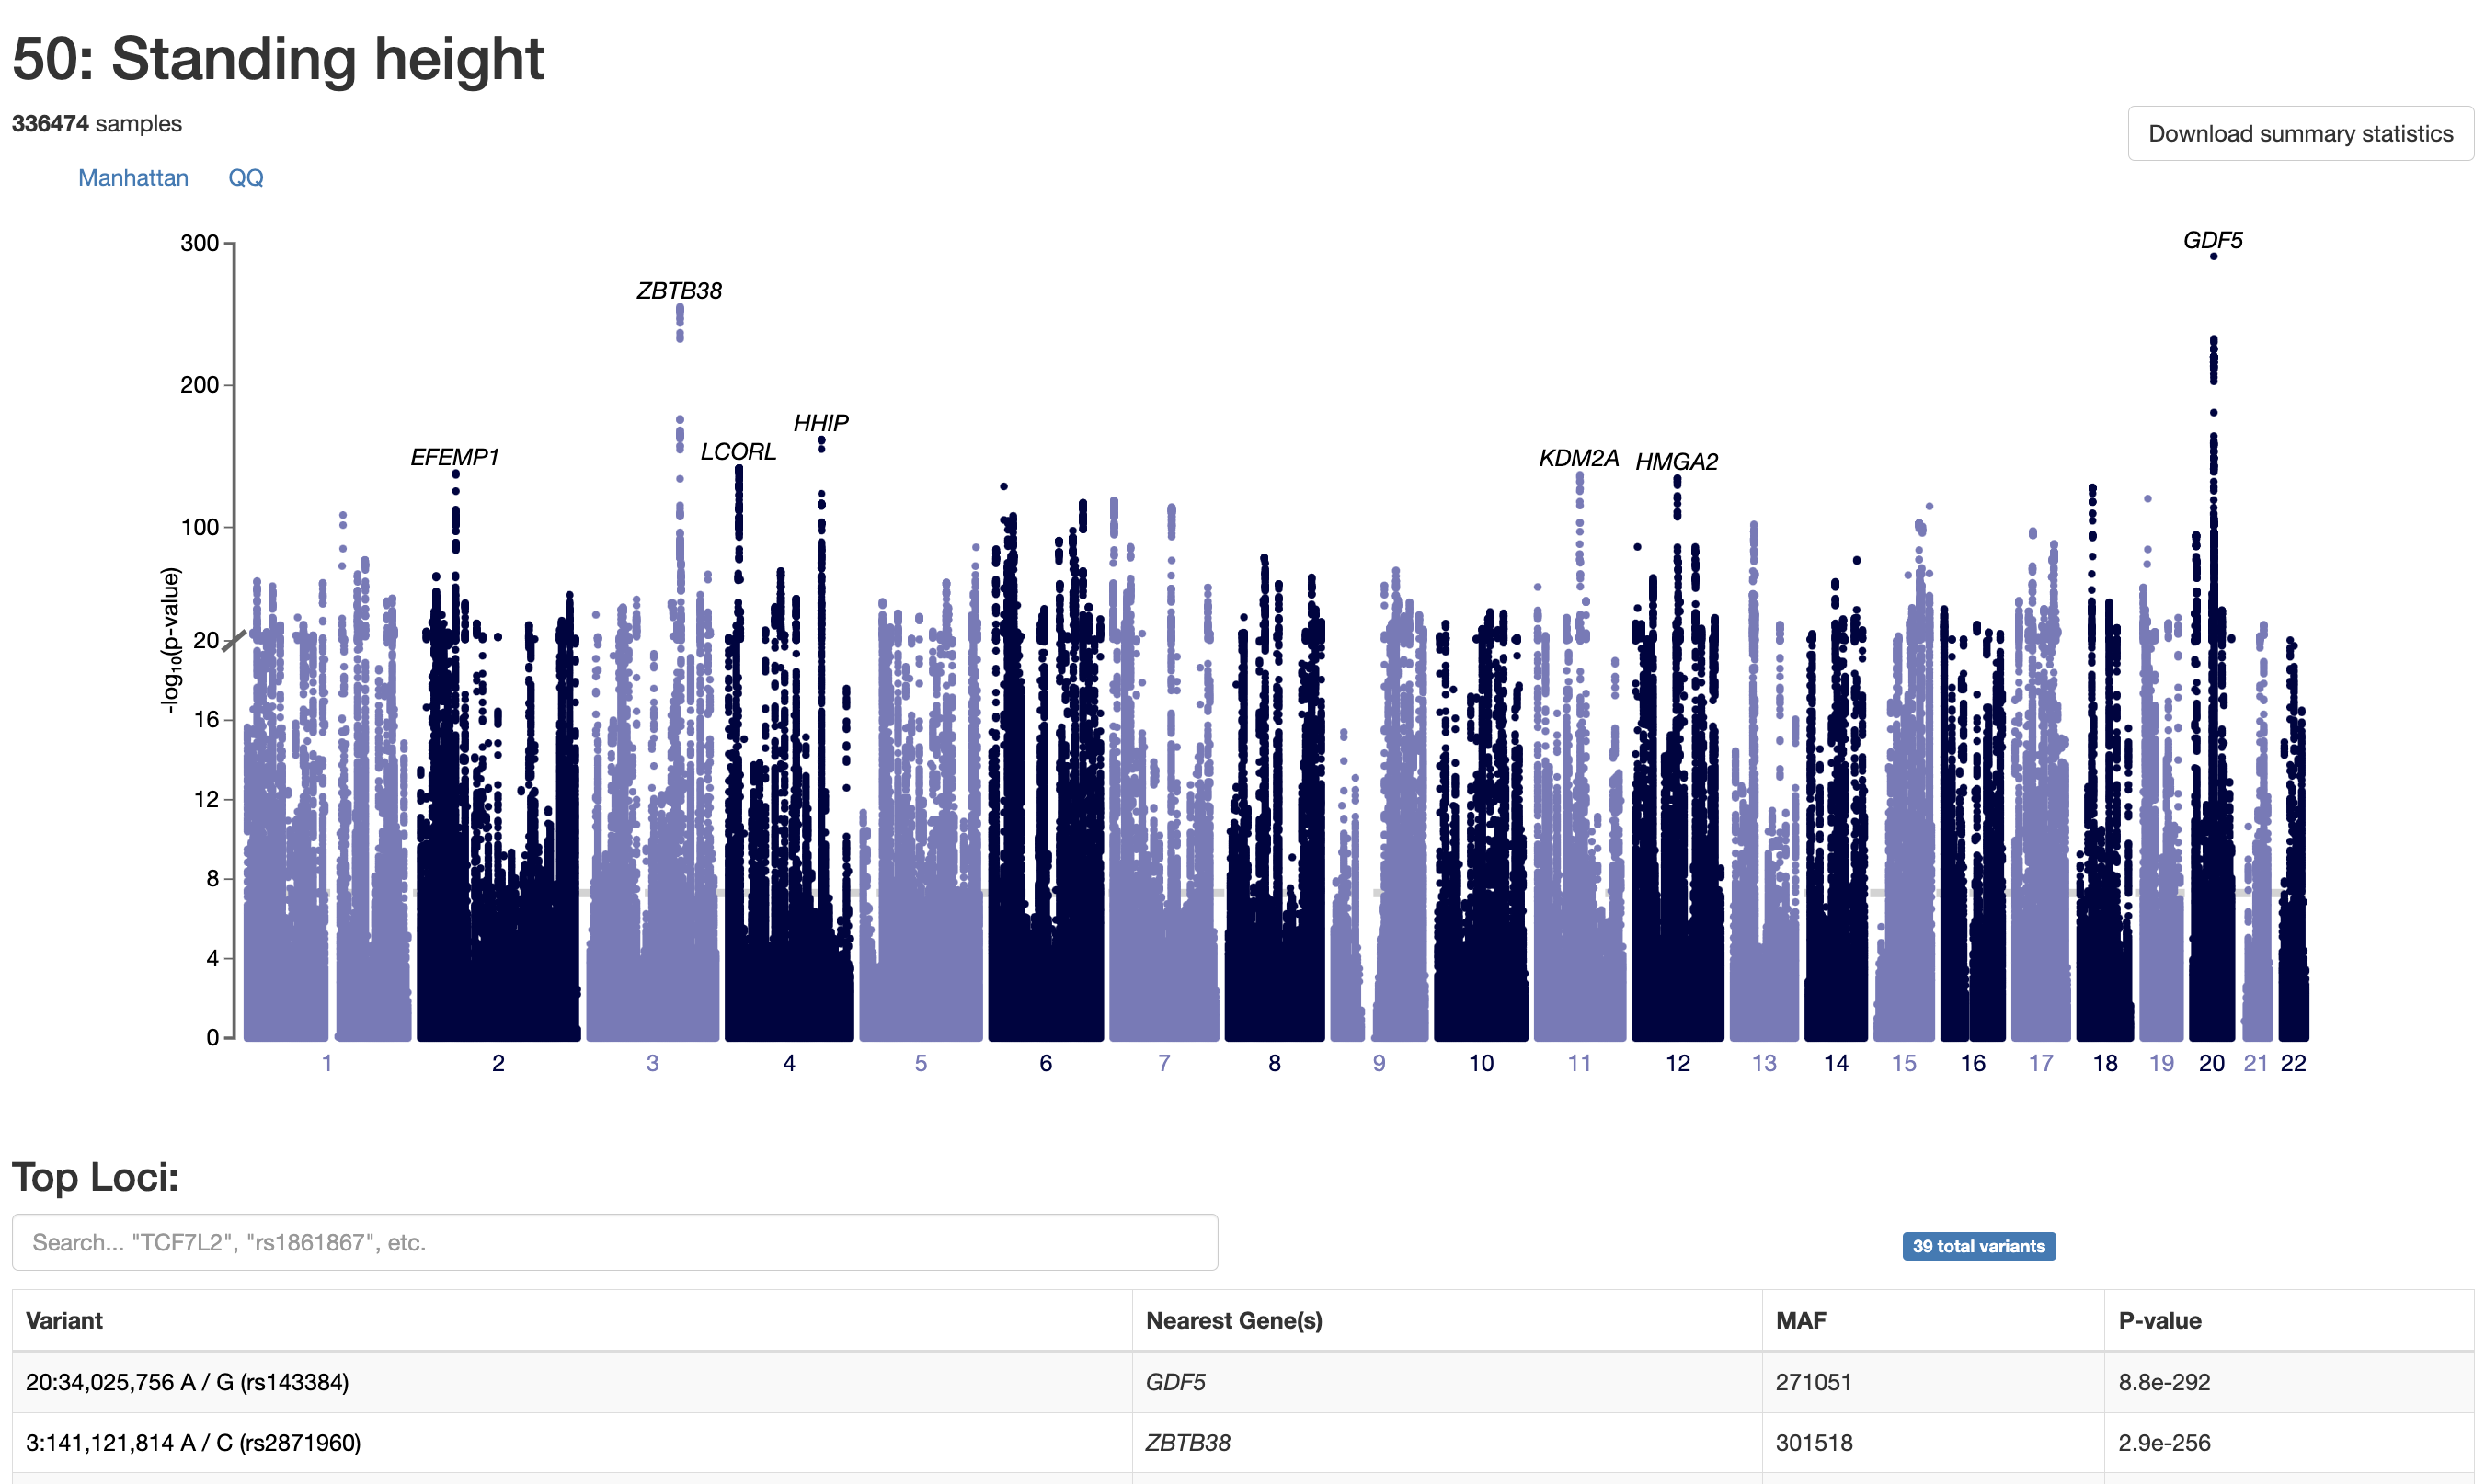
Fig. 8. GWAS results for standing height.
- For each phenotype, the browser shows a Manhattan plot of associated variants
- The top p-values for this trait look extremely significant
- Bottom of the page also has a QQ plot
Although these p-values are huge, keep in mind that for the vast majority of extremely strong associations, the total proportion of variance explained is very small (< 10%). (i.e., most of the natural variation in the phenotype is not explained by that variant.)