table
rbinom
genetic_diff
d()
Published with bookdown & the OTTR template)
Style adapted from: rstudio4edu-book (CC-BY 2.0)
ggplot
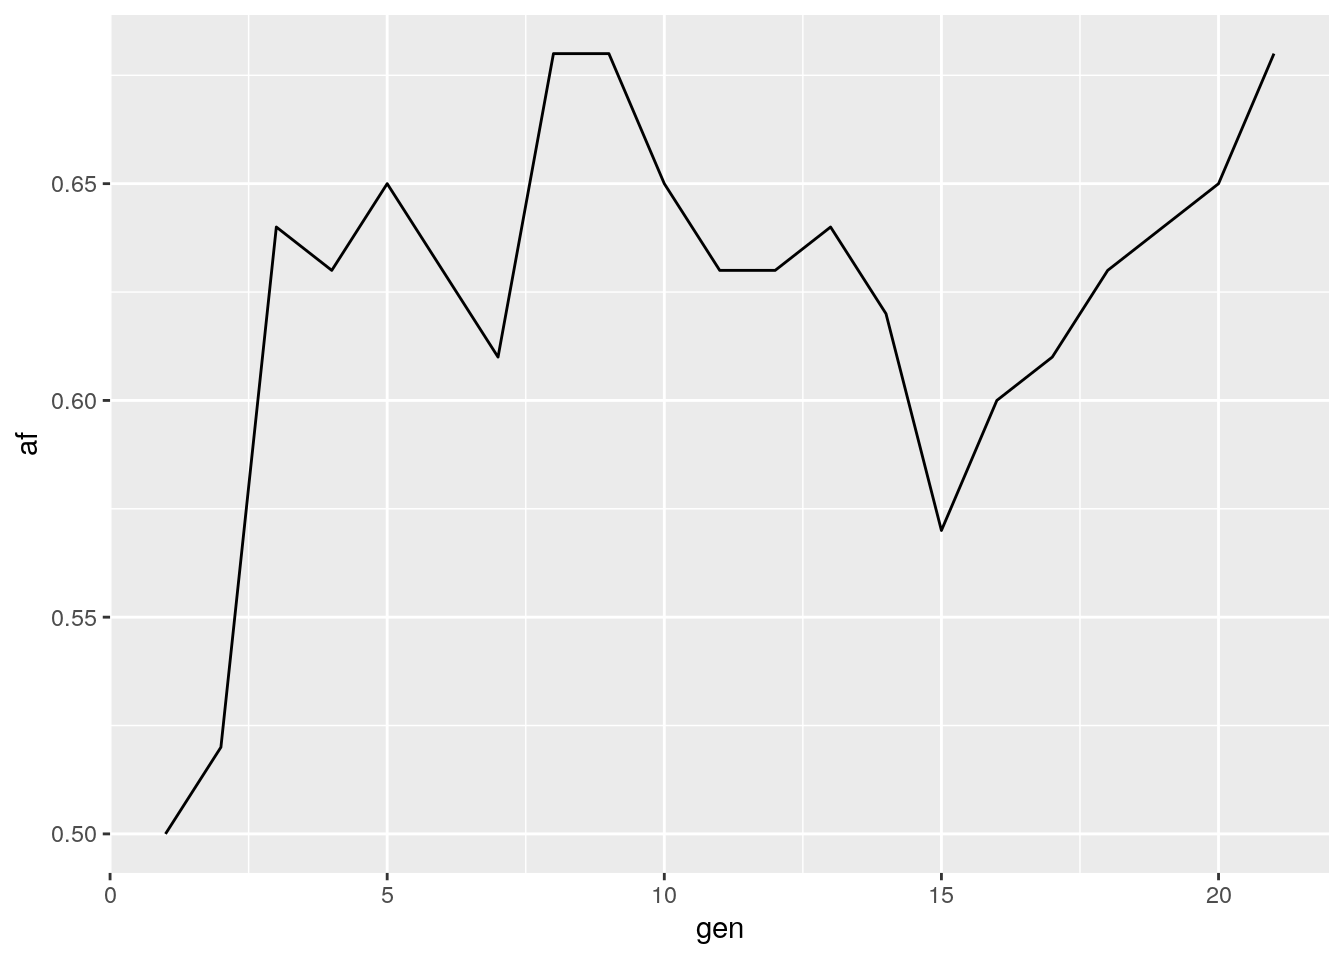
ggplot(data = sim_results,
       aes(x = gen, y = af)) +
  geom_line()