11.6 eQTLs in the GTEx Portal
The GTEx Portal includes an option to view all significant eQTLs for a gene, below the plots of tissue expression. Note that these eQTLs are labeled by tissue – they may not impact transcription outside of that tissue.
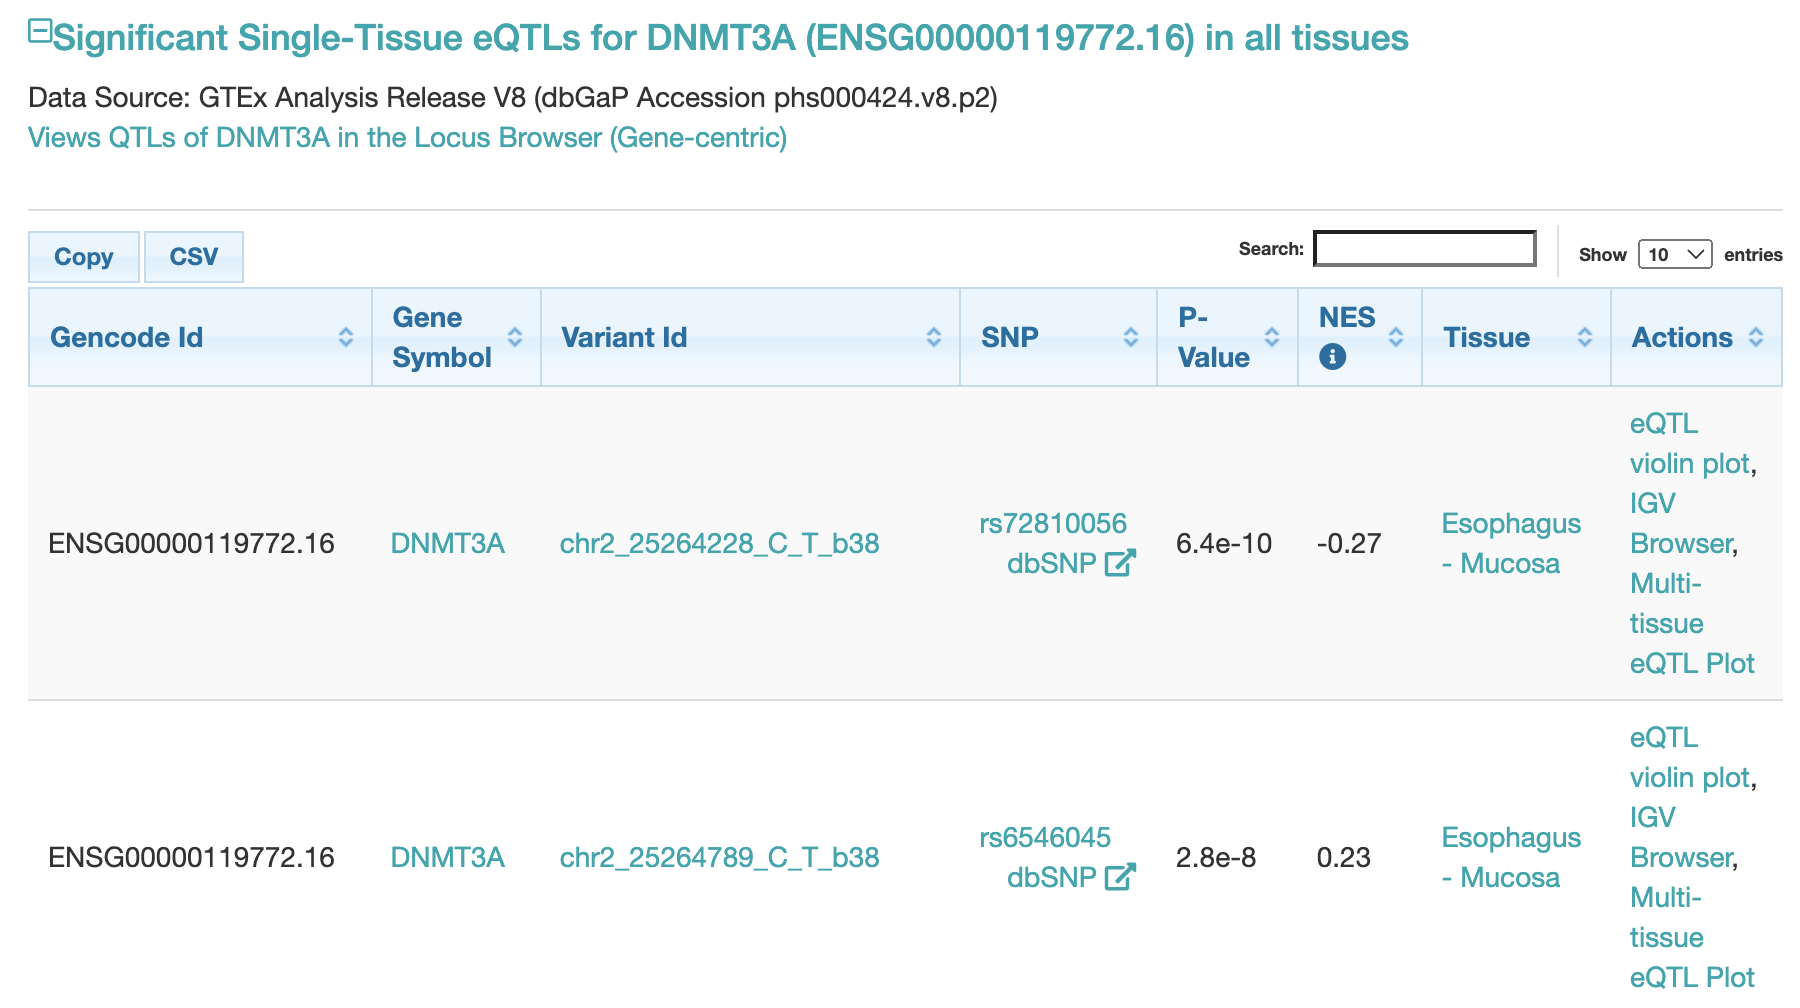
Fig. 5. Significant eQTLs for DNMT3A in the GTEx Portal.
eQTL violin plots
The Actions column provides quick access to several visualizations of each eQTL, including a violin plot that shows how it impacts expression:
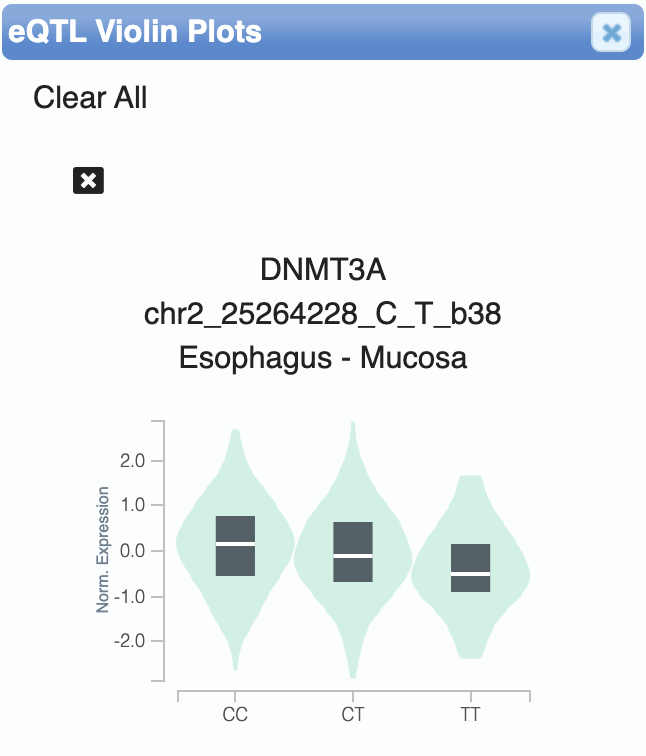
Fig. 6. The
T allele at the chr2_25264228_C_T_b38 SNP decreases DNMT3A expression.