10.19 Region-specific \(f_4\) ratio
Now we can re-calculate the \(f_4\)-ratio only within promoter regions.
# f4-ratio with only promoters
f4_filtered <- f4ratio(data = new_snps_keep,
                       X = pops, A = "Altai", B = "Vindija", C = "Yoruba", O = "Chimp") %>%
  # convert z score to pvalue
  mutate(p = 2 * pnorm(-abs(Zscore)))

f4_filtered
## A B X C O alpha stderr Zscore p
## 1 Altai Vindija French Yoruba Chimp -0.005541 0.028515 -0.194 0.84617588
## 2 Altai Vindija Sardinian Yoruba Chimp 0.002263 0.031027 0.073 0.94180612
## 3 Altai Vindija Han Yoruba Chimp 0.066668 0.029767 2.240 0.02509092
## 4 Altai Vindija Papuan Yoruba Chimp 0.010940 0.030057 0.364 0.71585801
## 5 Altai Vindija Khomani_San Yoruba Chimp 0.026367 0.031975 0.825 0.40937159
## 6 Altai Vindija Mbuti Yoruba Chimp 0.005176 0.030194 0.171 0.86422377
## 7 Altai Vindija Dinka Yoruba Chimp 0.008542 0.026768 0.319 0.74972651Plot the region-excluded \(f_4\)-ratios
ggplot(f4_filtered,
       aes(x = X, y = alpha, color = p < 0.05)) +
  geom_point() +
  geom_errorbar(aes(ymin = alpha - 2 * stderr, ymax = alpha + 2 * stderr), width = 0.5) +
  geom_hline(yintercept = 0, linetype = 2) +
  labs(y = "Neanderthal ancestry proportion", x = "Present-day individual")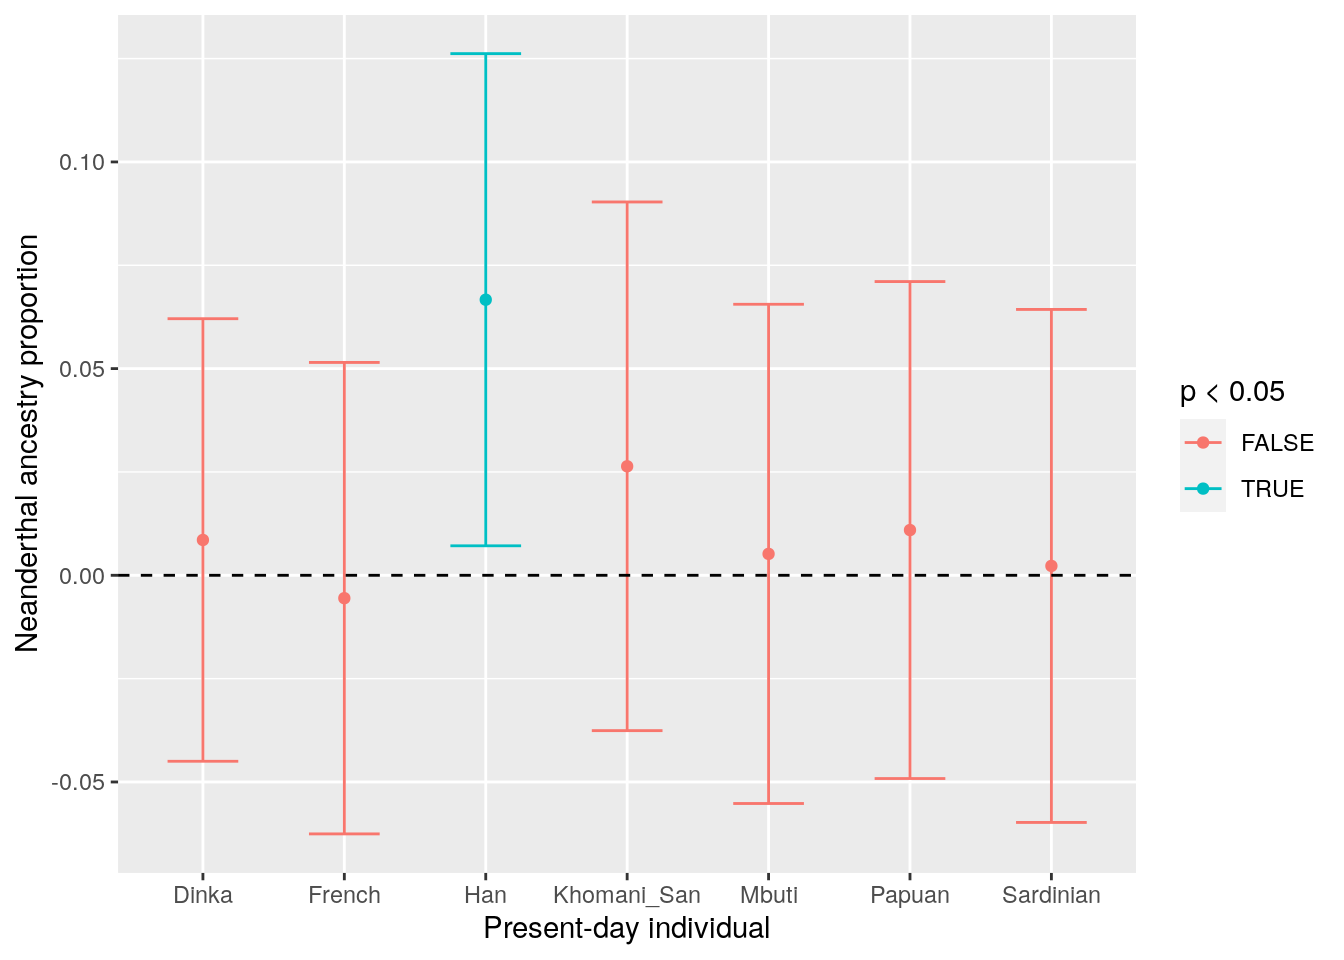
Except for the Han population, we see almost no Neanderthal ancestry when we calculate the \(f_4\)-ratio within promoters – supporting the idea that functionally important genomic regions are depleted for Neanderthal introgression.