5.19 Running a function
The code block we just wrote defines the function (i.e., tells R what it should do). Now we can run the function with parameters of our choosing and plot the output:
# run function
results <- run_sim(Ne = 1000, freq = 0.5, generations = 10000)

# plot output
ggplot(data = results,
       aes(x = gen, y = afs)) +
  geom_line()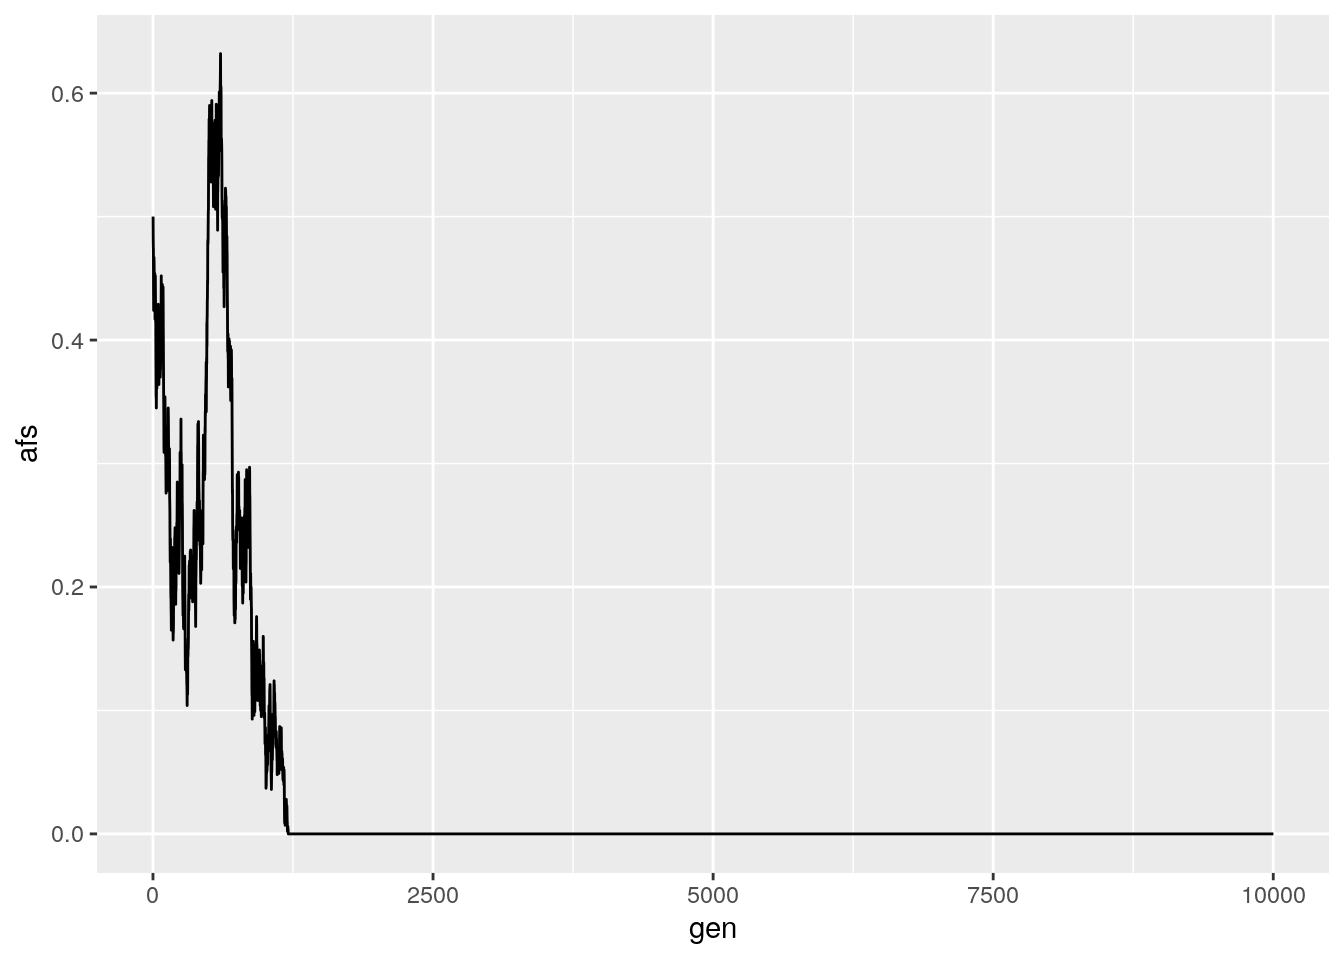
Run your run_sim function a few times with different input population sizes and AFs. How does changing these inputs affect the AF trajectories that you see?
# simulate a very large population
results <- run_sim(Ne = 100000, freq = 0.5, generations = 1000)

# plot output
ggplot(data = results,
       aes(x = gen, y = afs)) +
  geom_line()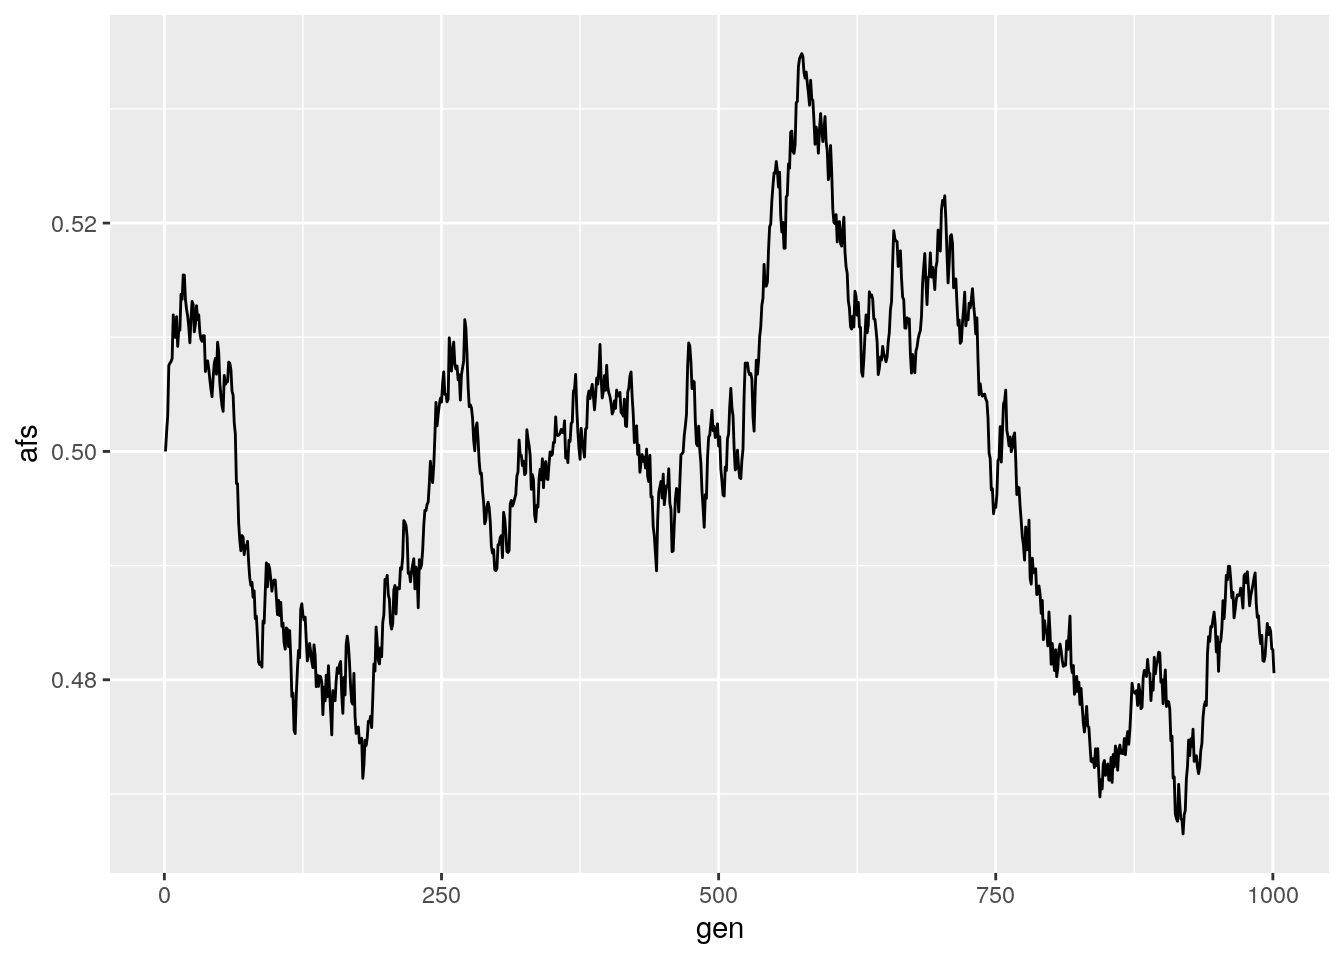
# simulate a population with AF closer to 0
results <- run_sim(Ne = 1000, freq = 0.1, generations = 1000)

# plot output
ggplot(data = results,
       aes(x = gen, y = afs)) +
  geom_line()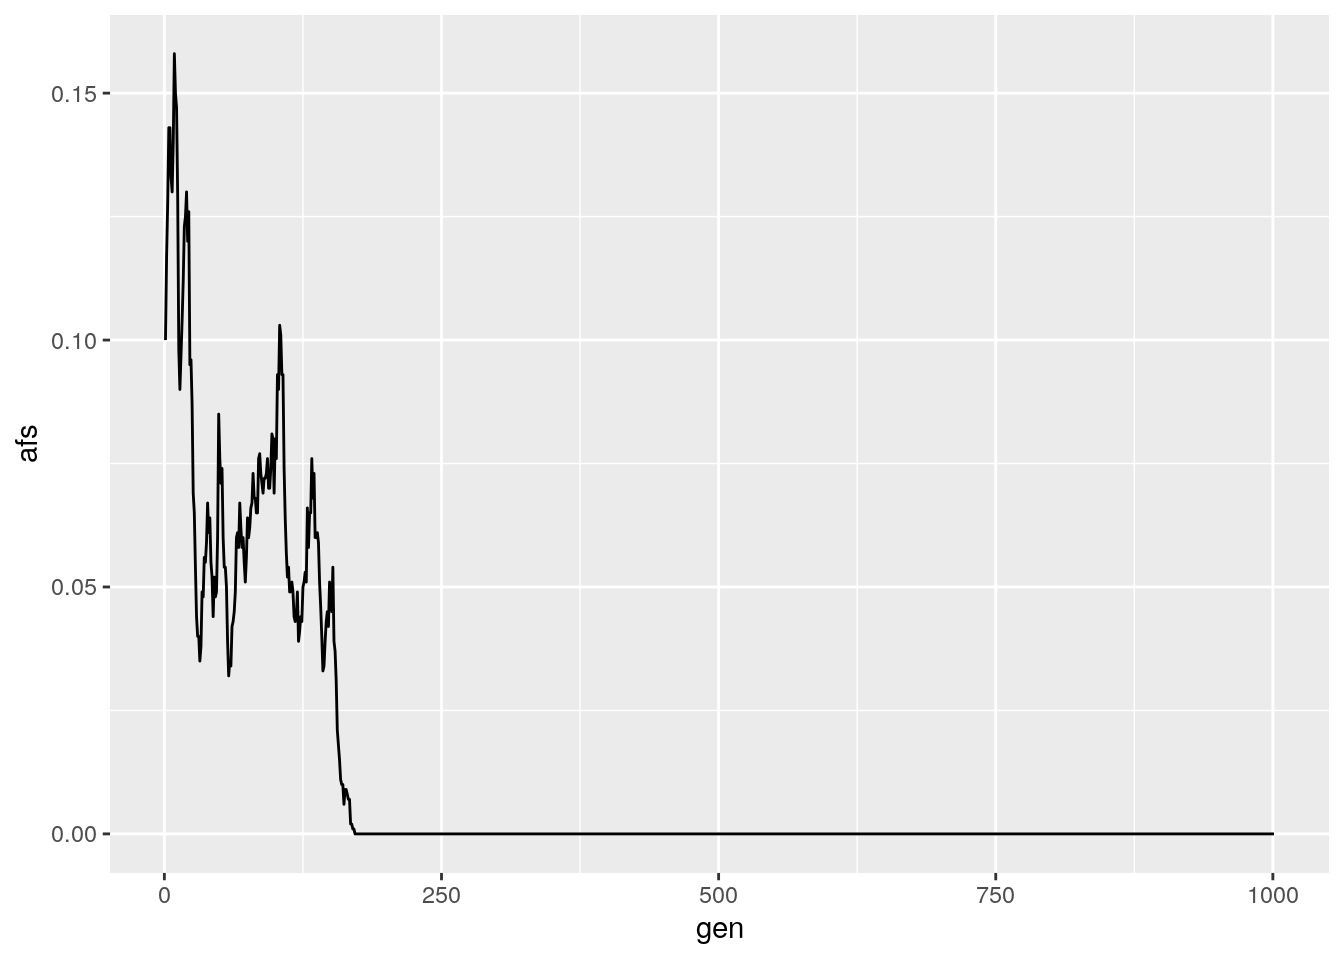
In general, decreasing the population size or shifting the starting AF away from 0.5 will decrease the time to fixation for an allele.