Plotting GWAS results
The qq() and manhattan() functions in the qqman package let us easily create QQ and Manhattan plots to visualize our GWAS results.
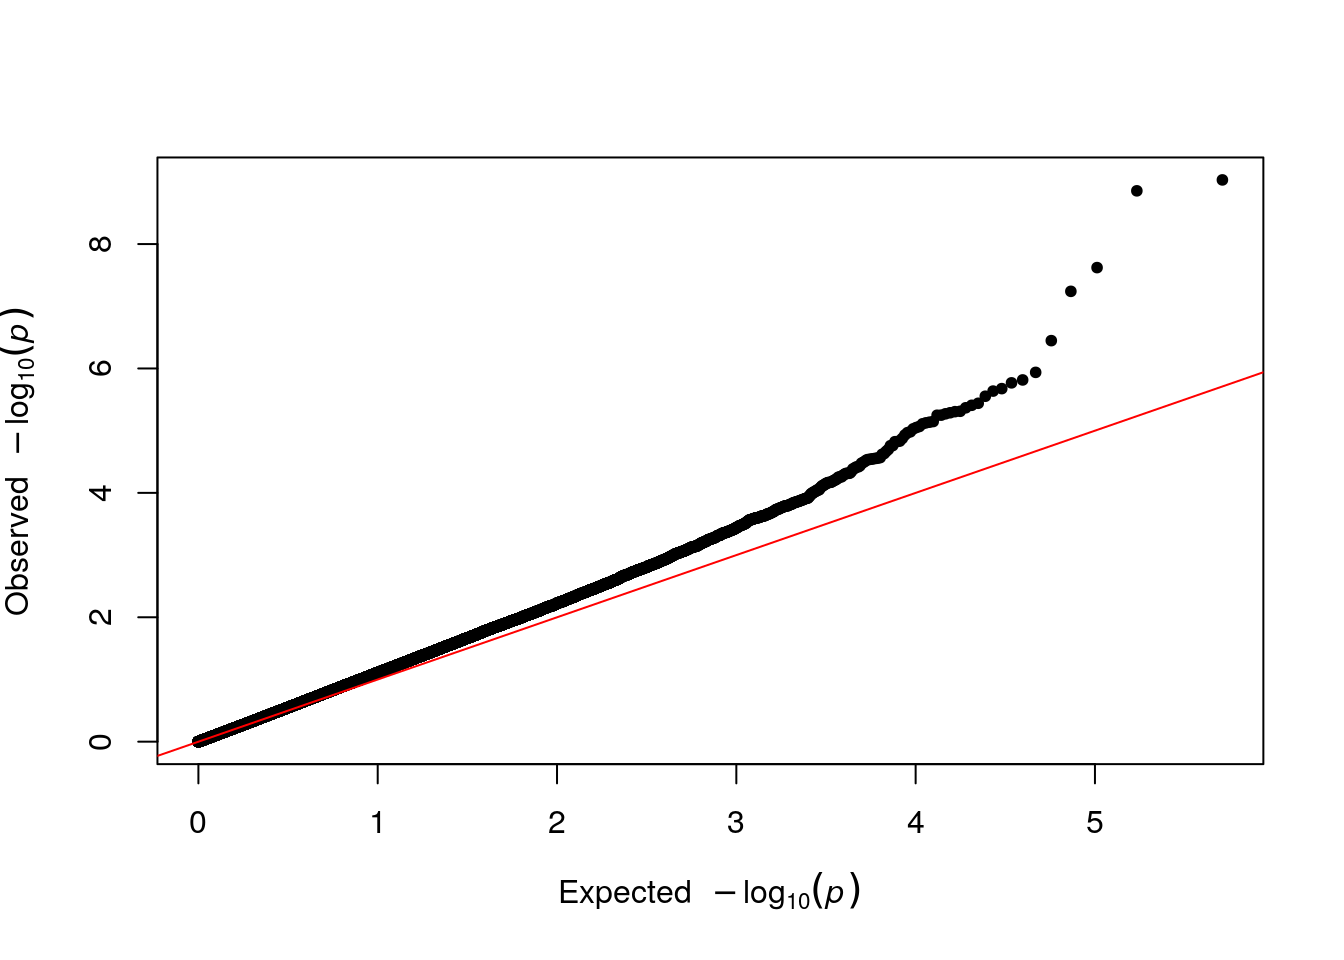
# qq plot using the P (pvalues) column
qq(results$P)
# manhattan plot
manhattan(results)
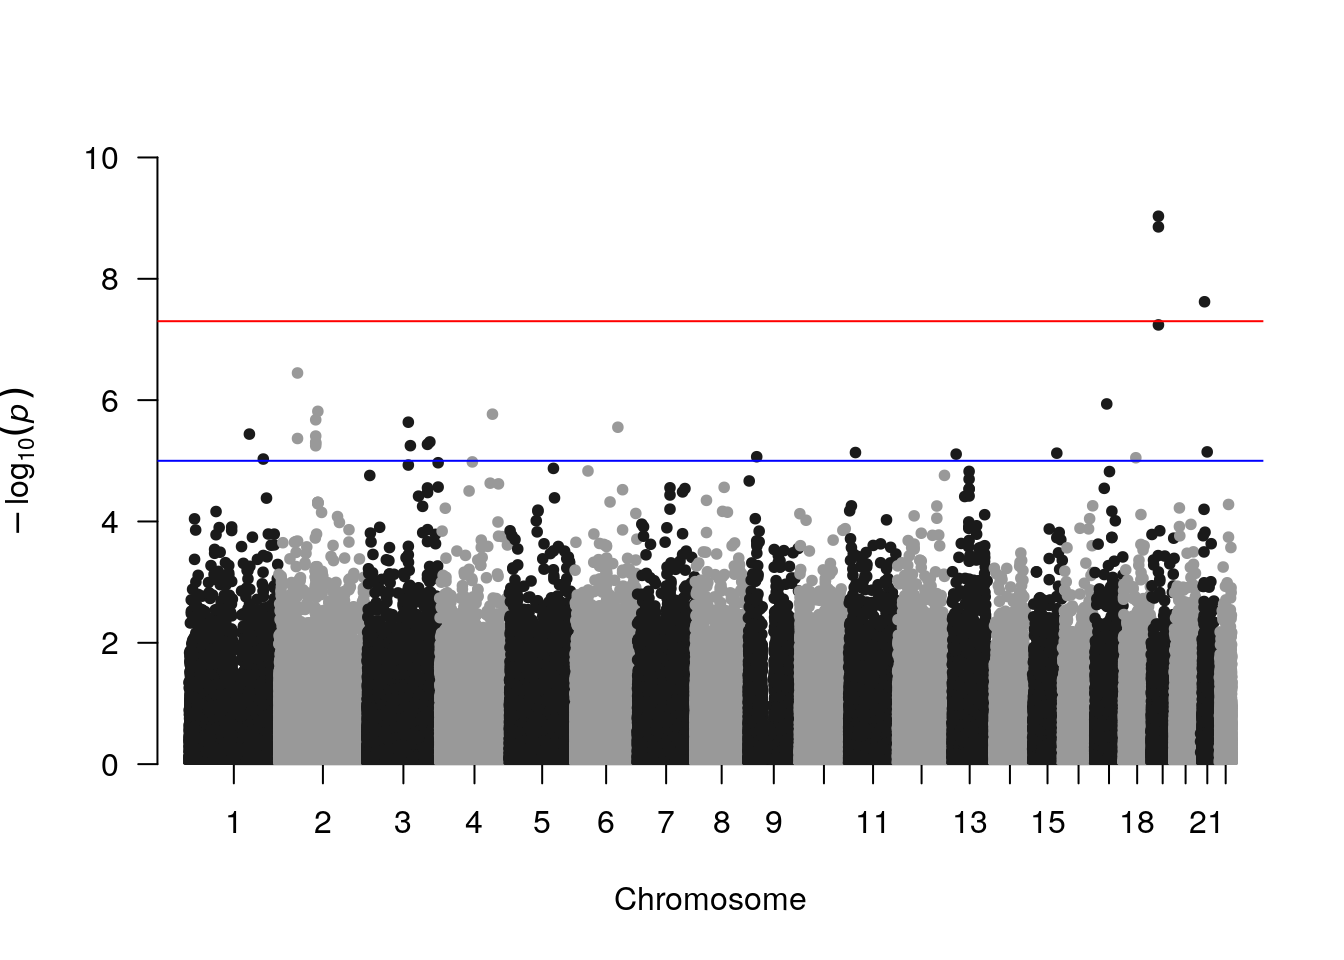
SNPs with low p-values occur in peaks of multiple variants. These are not independent associations, but rather groups of variants in LD.