2.11 Viewing sequencing reads in IGV
Now that we’ve seen what raw sequencing data looks like, let’s look at it in IGV.
Return to your IGV tab, where you should have one sample’s DNA sequencing data loaded. Make sure you’re zoomed in enough for the data to display.
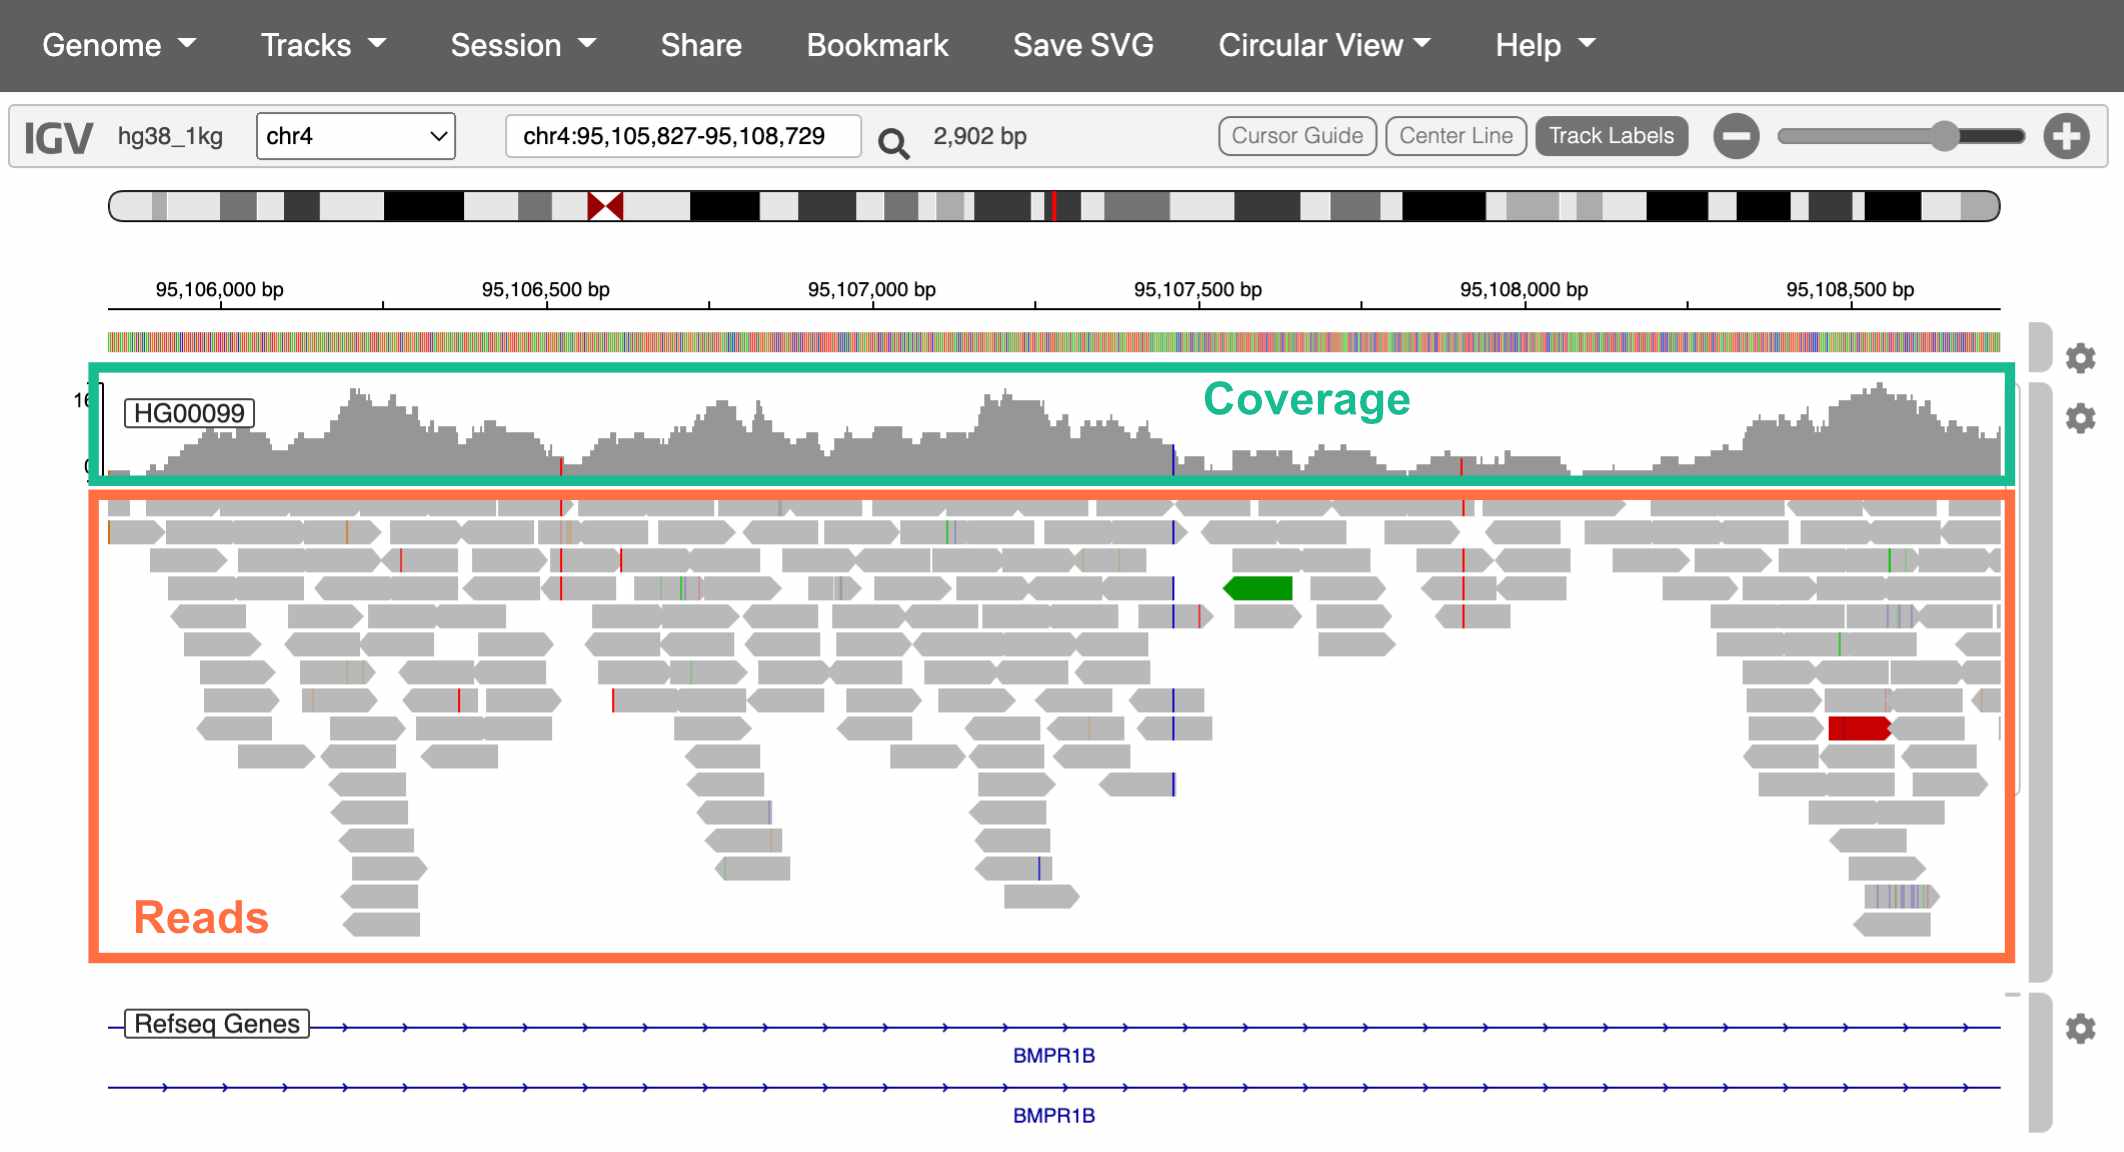
Fig. 18. The
Reads tab in SRA.
The top track is a histogram of sequencing coverage (i.e., how many reads there are at that position in the genome). The bottom track shows the reads themselves.
How do we know where in the genome each read belongs?
We match the sequence of the read to the sequence of the reference genome (called alignment). With 100bp reads, the probability that a match occurs by chance is \(\frac{1}{4^{100}}\), or \(6.2 * 10^{-61}\).
Extracting alignment information in IGV
If you click on a specific read, IGV will display additional information about it, including:
- The exact position it aligns to
- The mapping quality (a score indicating how uniquely it aligns to this position)
- If you’re working with paired-end sequencing data, where its paired read is
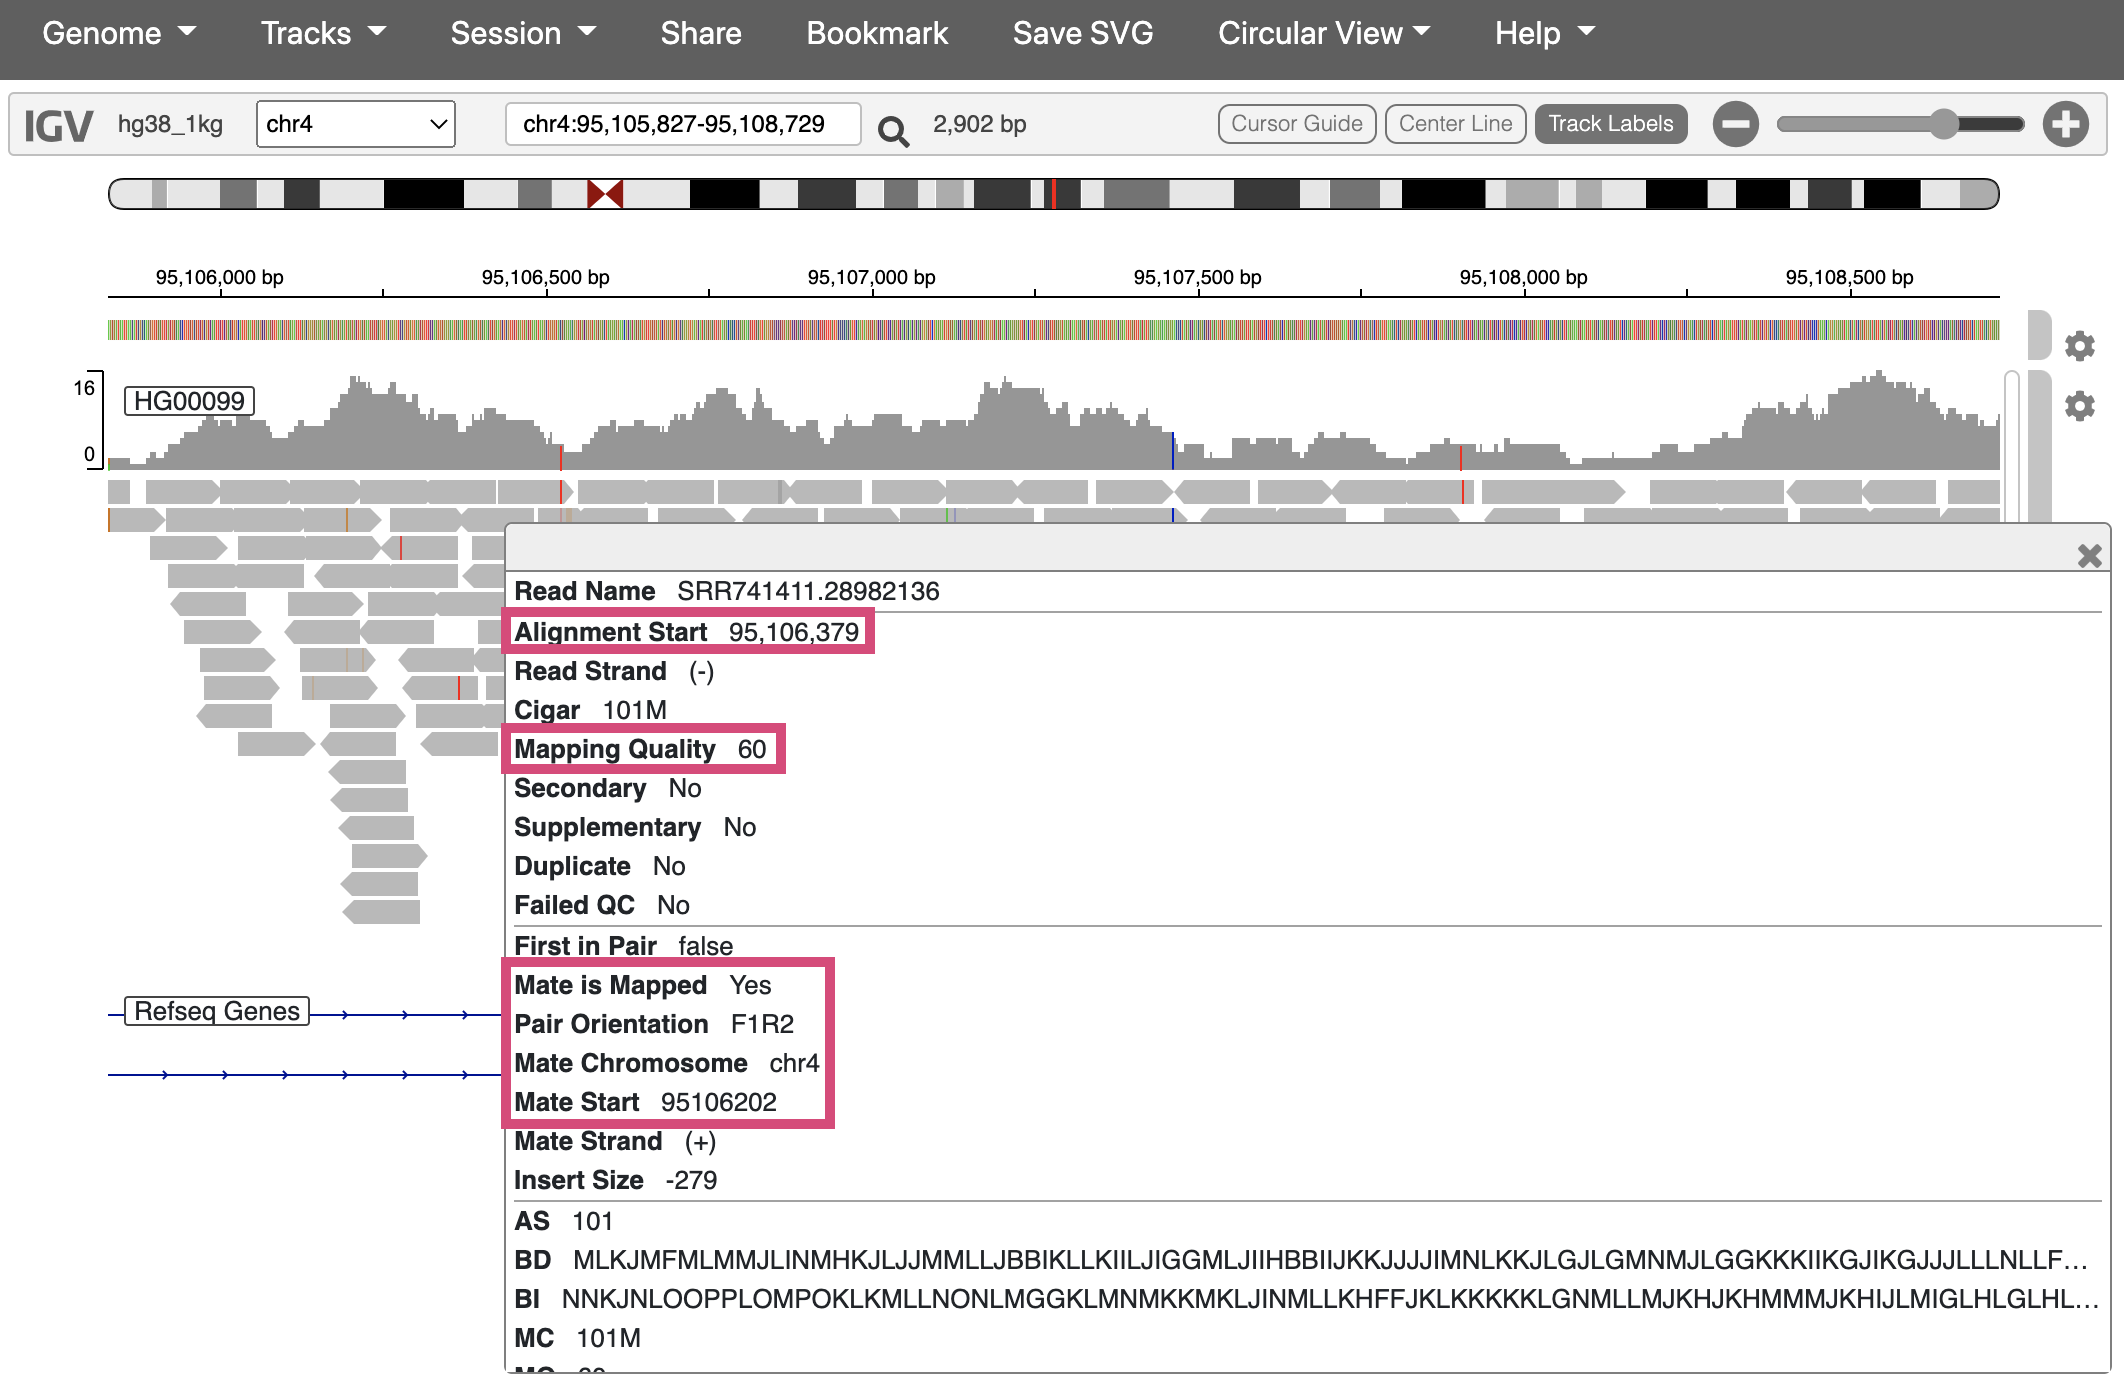
Fig. 19. Viewing additional info for one sequencing read.